Iceberg PowerPoint Template and Google Slides
9
About the Template
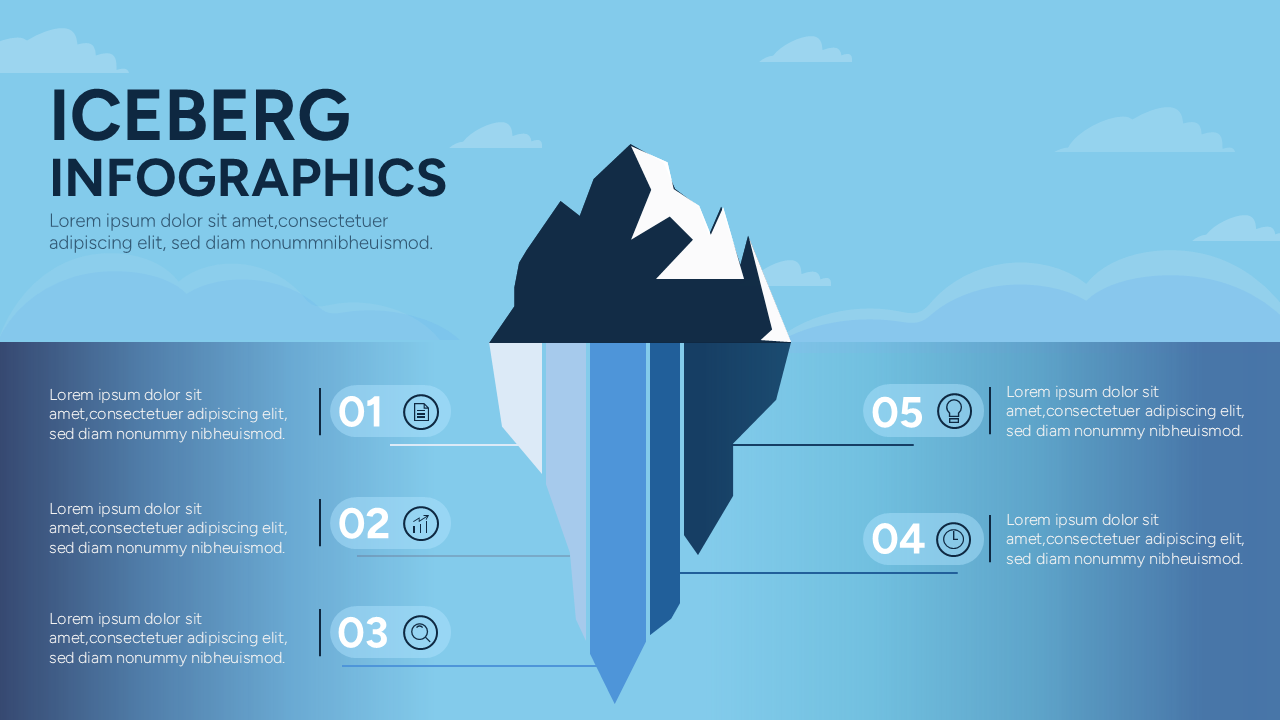
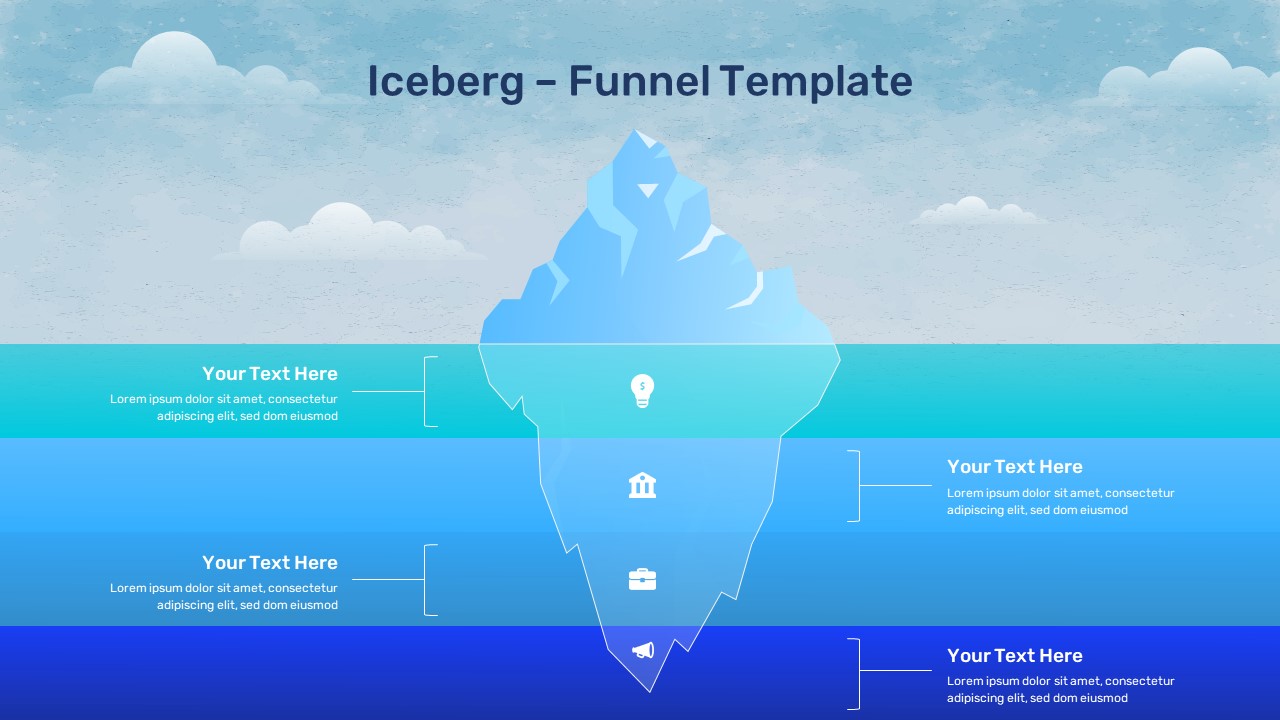
Iceberg Presentation Templates
Explain complex processes or hierarchical structures with this creative iceberg PowerPoint infographic template and Google Slides. Ideal for science, business, and educational content. We often struggled to visually represent the hidden layers of a complex issue. Our Iceberg Infographic template for PowerPoint and Google Slides is the perfect solution.
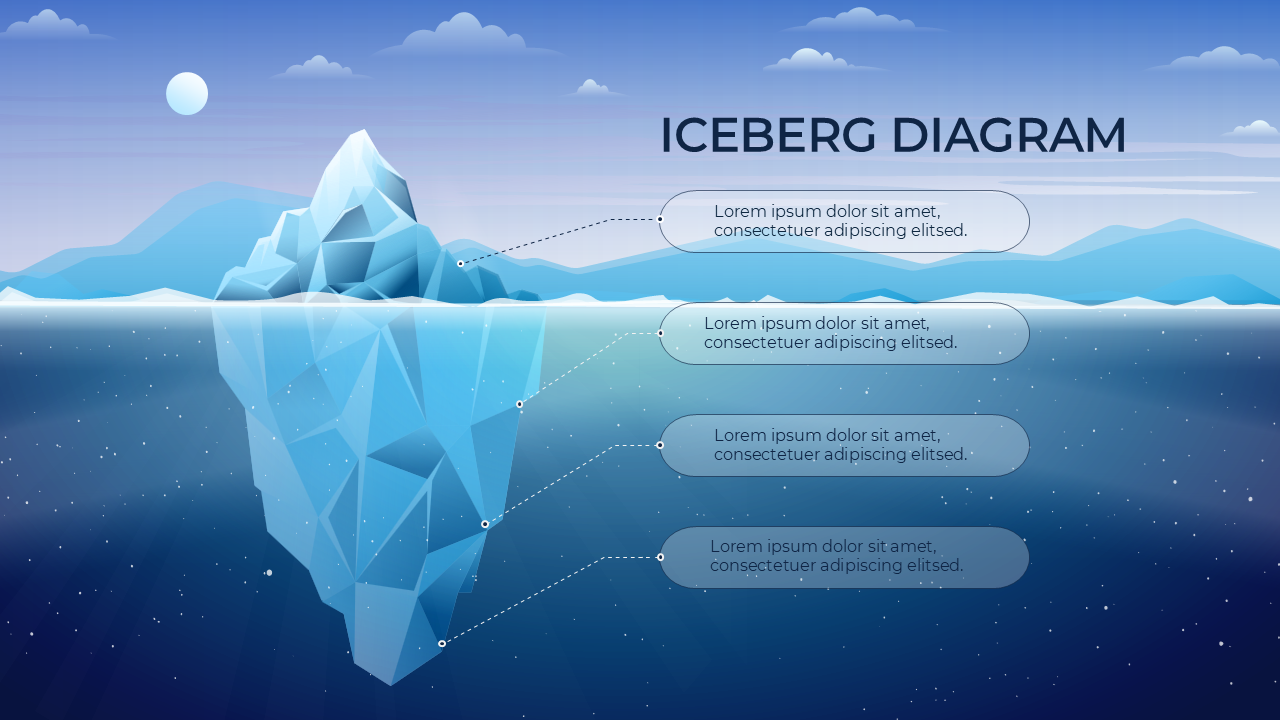
This versatile infographic template transforms static data into a captivating visual, allowing you to effectively communicate complex information in a clear and engaging manner.
Whether you’re explaining the stages of a project, the layers of an organization, or the underlying factors contributing to a phenomenon, these free iceberg templates provides a powerful and instantly recognizable framework. This iceberg template empowers you to create impactful presentations that resonate with your audience and leave a lasting impression.
Who Should Download This Iceberg Infographic Template?
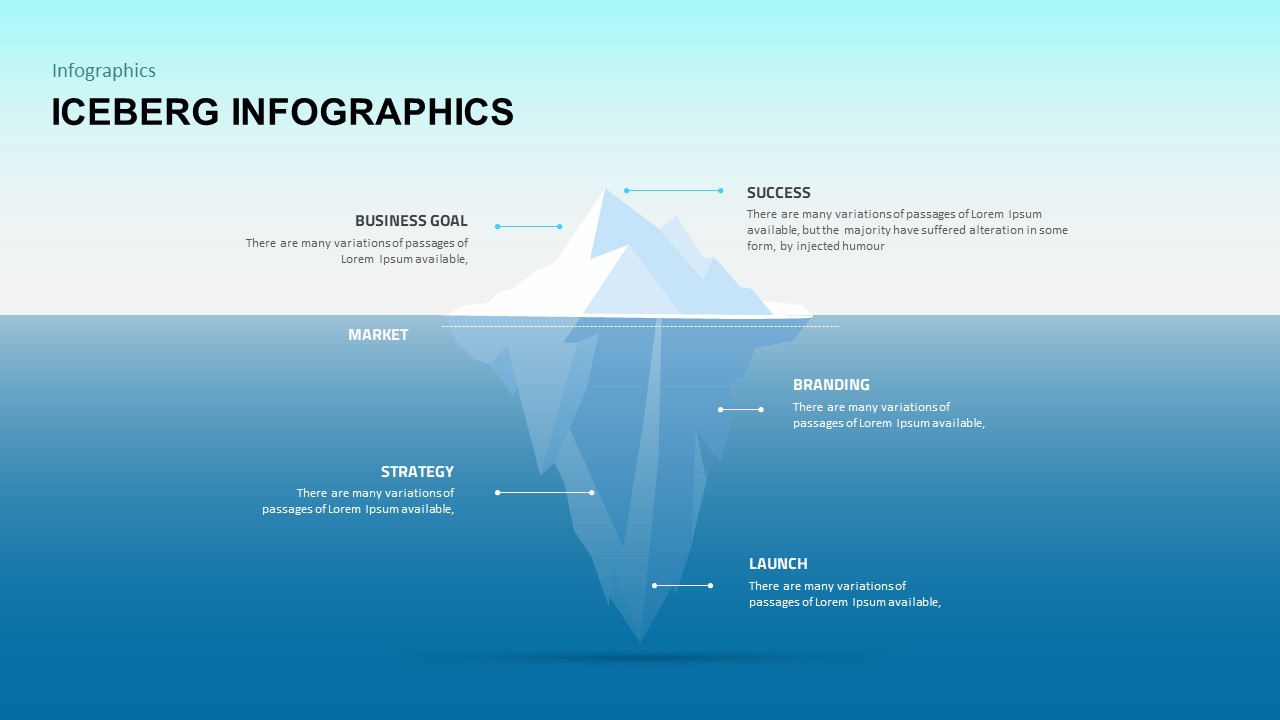
- Business Professionals: Visualize project risks, hidden costs, market analysis (showing the visible market share vs. the untapped potential), or the various stages of product development. Use it to illustrate the structure of your organization, highlighting the management level above the surface and the essential teams working behind the scenes.
- Educators: Explain complex scientific concepts, historical events, or literary themes. For example, illustrate the visible effects of climate change versus the underlying causes and long-term consequences.
- Scientists and Researchers: Present research findings, highlighting the initial observations that led to further investigation and the deeper insights uncovered through rigorous study. Illustrate the layers of a scientific theory, showing the observable phenomena and the underlying principles that explain them. The iceberg can effectively communicate the depth and breadth of your research.
- Project Managers: Visualize project timelines, demonstrating the completed tasks above the waterline and the remaining milestones and challenges below. Showcase resource allocation, highlighting the readily available resources and the contingency plans in place for unforeseen circumstances. The iceberg helps communicate the full scope of a project and the effort required for successful completion.
- Marketers: Illustrate marketing campaign performance, highlighting the visible results (website traffic, social media engagement) and the underlying strategies and tactics driving those results. Showcase the customer journey, highlighting the initial touchpoints and the deeper engagement and relationship building that occurs over time.
- Anyone needing to present complex data: Whether you’re a student, a non-profit worker, or simply someone who needs to communicate information effectively, this template can help you create visually compelling presentations that are easy to understand and remember.
Stop struggling to visualize complex information. Download our Iceberg PowerPoint Template and Google Slides today and start creating impactful presentations that captivate your audience and drive your message home. Transform your data into a compelling visual story and unlock the power of the iceberg metaphor.
Google Slide,PowerPoint
100% Fully Customizable
Free to use
Related
-

3D Iceberg Diagram for PowerPoint and Google Slides
-
Free Iceberg Template for PowerPoint and Google Slides
-
Project Proposal Template for PowerPoint and Google Slides
-
Data Analysis Report Template – Free PowerPoint and Google Slides
-
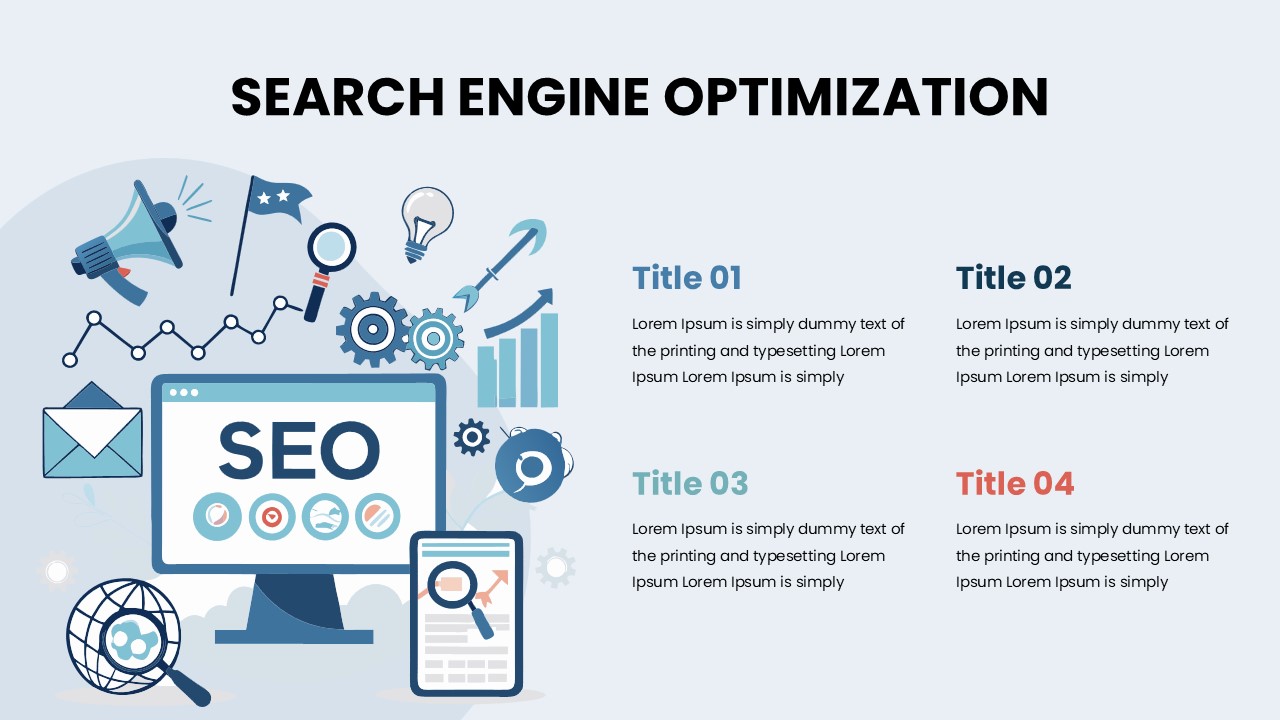
Free SEO Infographic Template for PowerPoint and Google Slides
-
Free Creative Iceberg Funnel Diagram PowerPoint & Google Slides

Are you looking for Custom Presentation Template Designs?
It is a long established fact that a reader will be distracted by the readable content of a page when or randomised words which don’t look even slightly believable