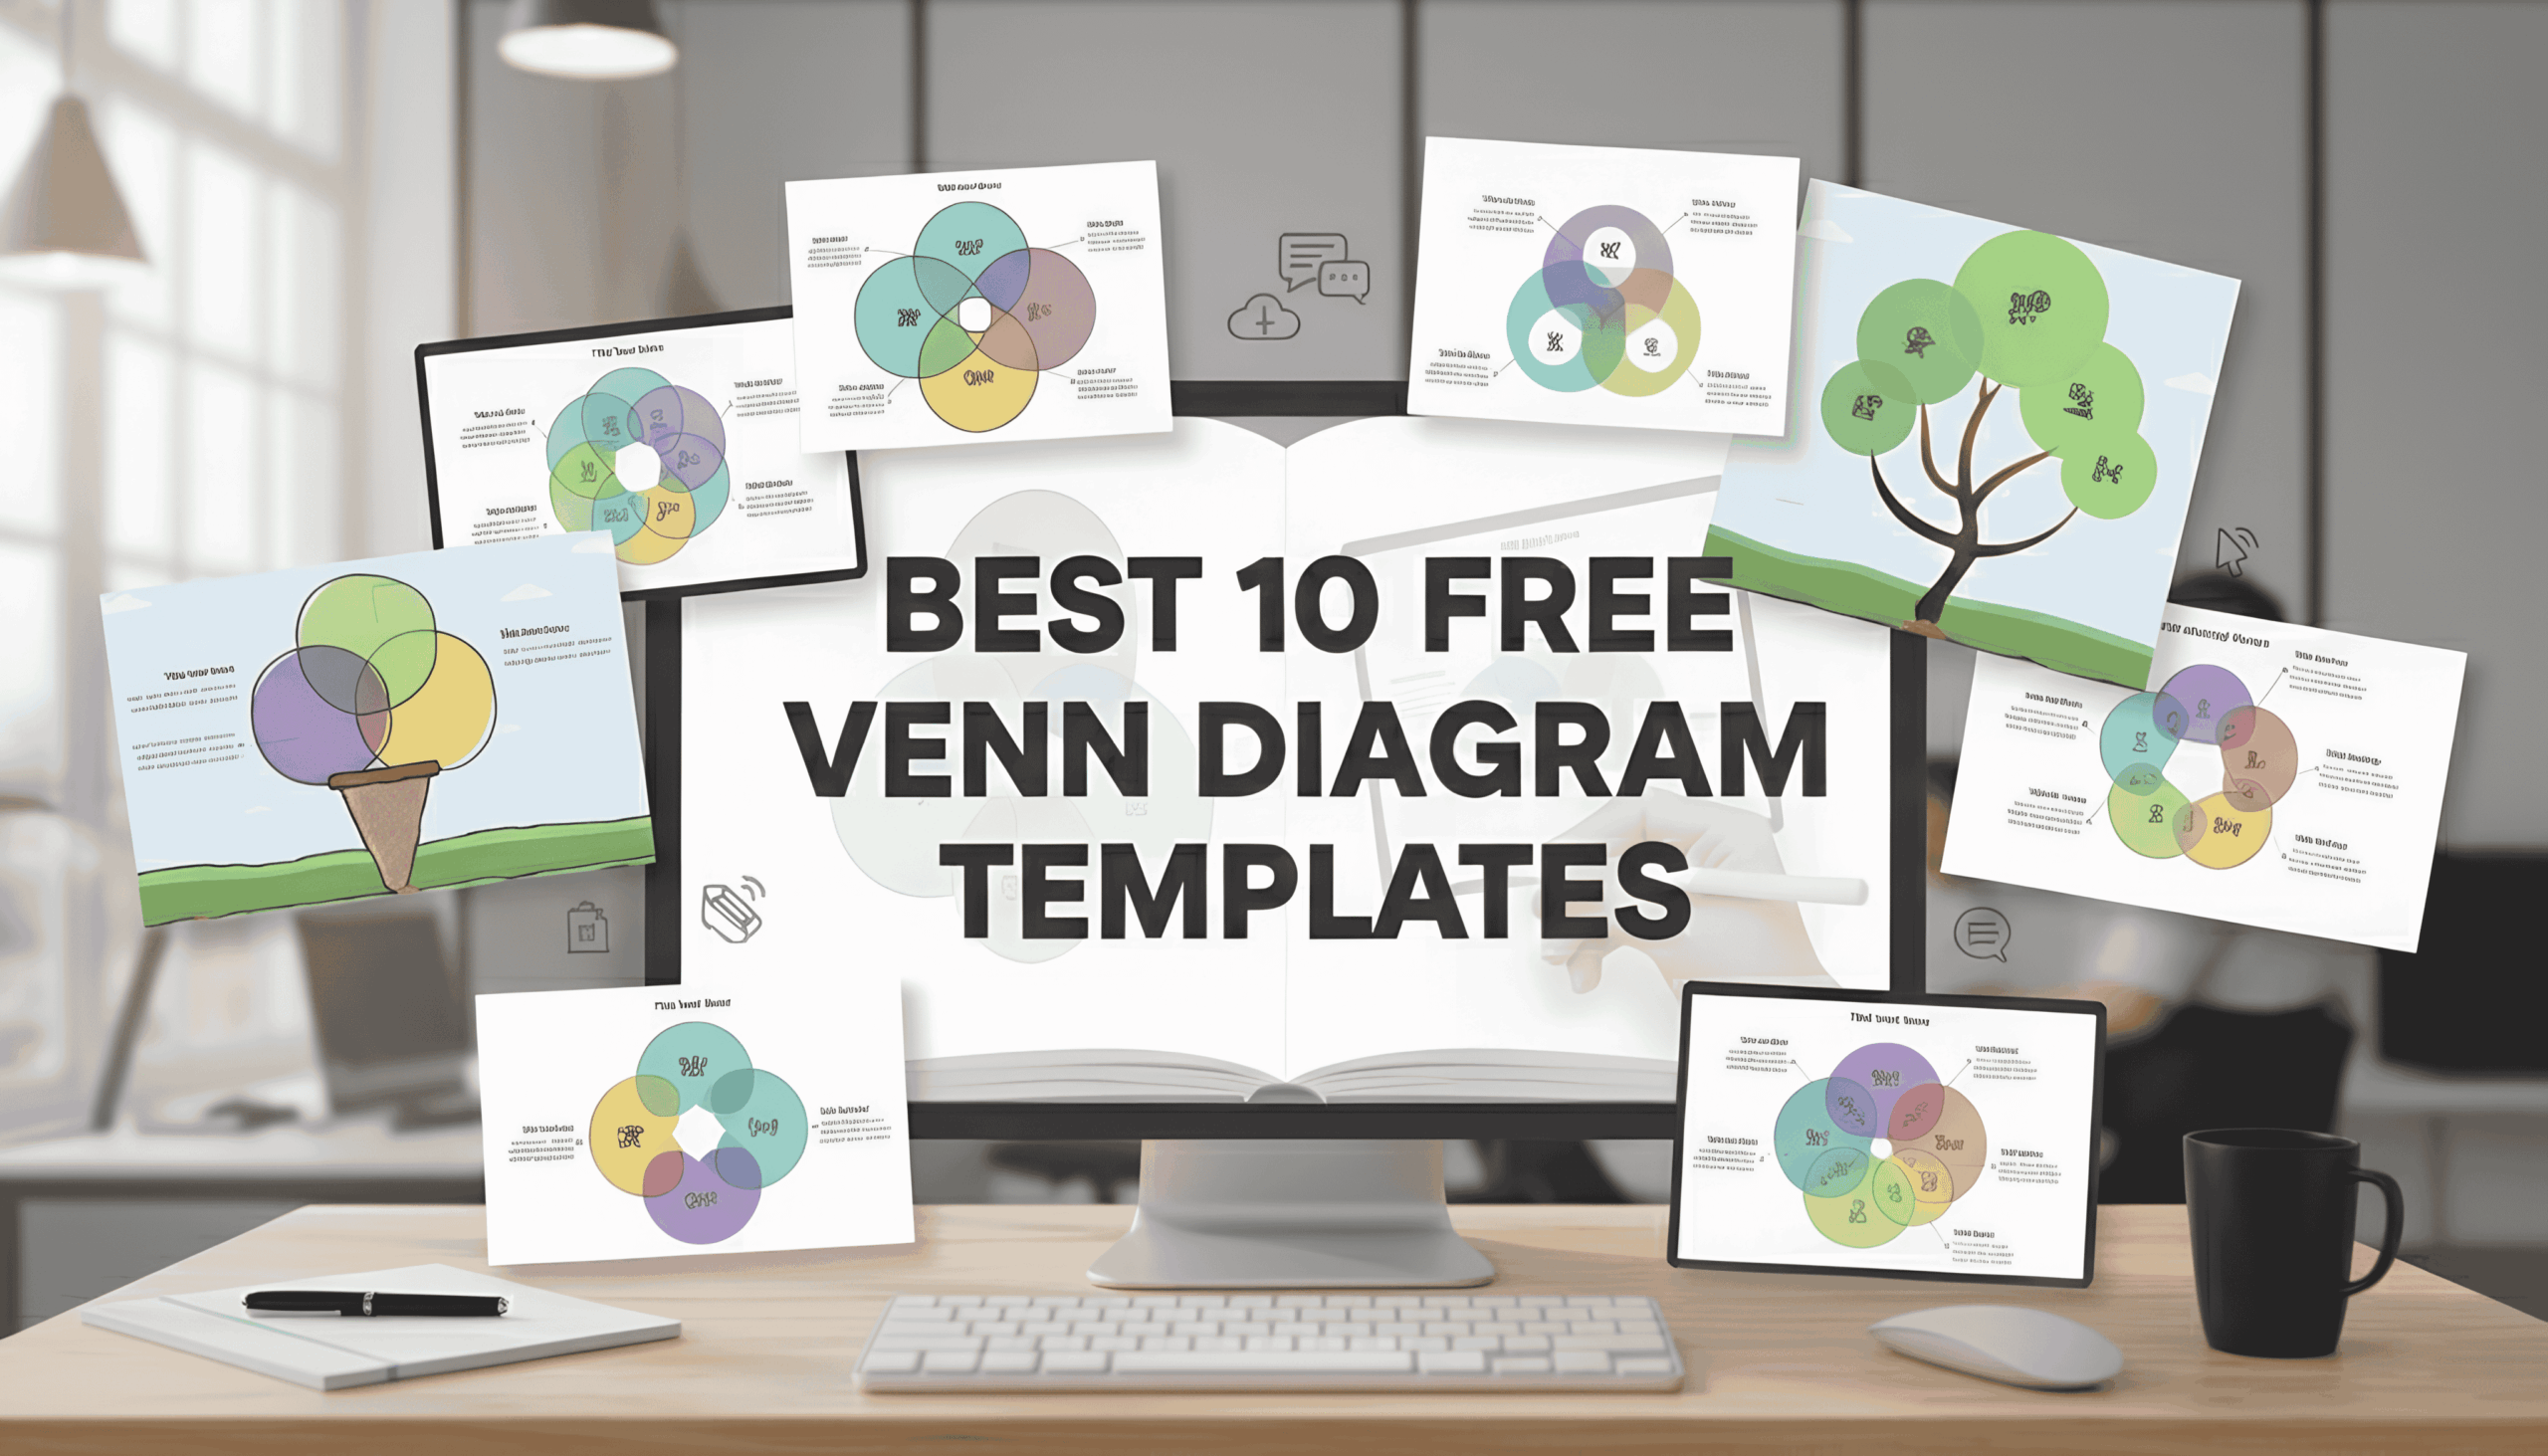
Best 10 Free Venn Diagram Templates (Blank Venn Diagram)
Perfect Selection of Triple Venn, Blank Venn Diagram Template & Creative Venn Designs
Are you tired of staring at blank pages when you need to visualize complex data? Whether you’re a student, a business professional, or just trying to organize your thoughts, the Venn Diagram is one of the simplest yet most powerful tools for showing relationships between sets of information. It’s the ultimate visual aid for comparing and contrasting, and that’s why finding the best Venn Diagram templates is so crucial for streamlining your workflow.
The problem is, not everyone has access to professional graphic design software, and drawing a clean, professional-looking Venn diagram from scratch can be a real pain.
Luckily, you don’t have to! We’ve done the heavy lifting for you. In this listicle, we’ve gathered the 10 best free Venn Diagram templates available online. These aren’t just circles on a page—they’re fully customizable, easy-to-use templates that work with common software and online tools.
Get ready to effortlessly create stunning visuals for your next project, presentation, or blog post. Let’s dive into the best free templates that will make visualizing data simple and stylish!
Free Venn Diagram PowerPoint, Google Slides and Canva Templates to Not Miss in 2026
What is a Venn Diagram? Venn Diagrams aren’t just amazing visualization tools; they also provide great opportunities to showcase qualitative data and a bit of graphics. Basically, these diagrams add a fun element to the presentation. If you don’t want to craft Venn Diagrams from scratch, here we have compiled some of the best Venn Diagram templates to help you get started.
Ice Cream Cone Venn Diagram
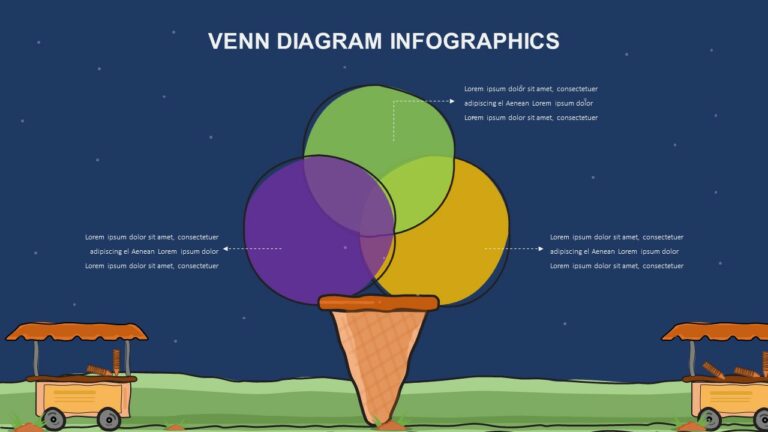
This delightful triple Venn diagram transforms the classic three-set comparison into a whimsical, three-scoop Ice Cream Cone Venn Diagram. It’s an easy to use graphic perfect for adding a fun, eye-catching touch to presentations, allowing you to clearly illustrate relationships between concepts while keeping your audience fully engaged. You can easily edit this template by changing the colors or simply using the provided text box labels to compare three different categories and highlight their areas of overlap.
Tree of Concepts Venn Diagram
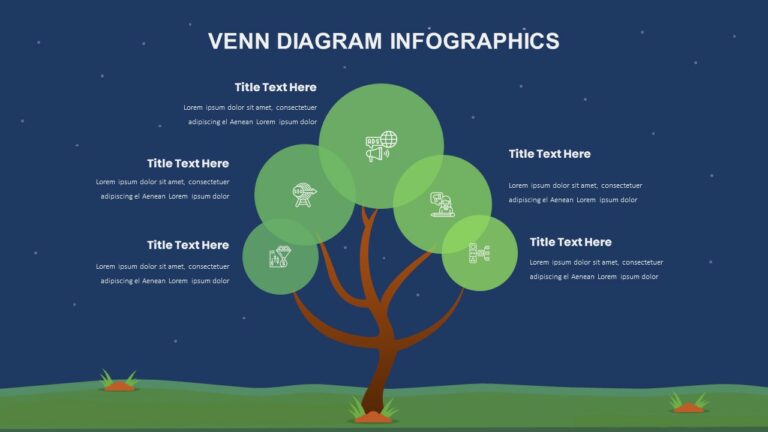
Looking for a graphic to show growth, interconnectedness, or project branches? This unique tree-shaped Venn diagram template is a refreshing break from standard circular charts and graphs. Instead of just a simple overlap, the green circles form the foliage of the tree, allowing you to visually illustrate how up to five different concepts or categories are related to the central idea (the trunk) and to each other. It’s an editable template ideal for showcasing business growth strategies, the various components of a marketing plan, or the core values of a brand. Simply add text and icons to the overlapping circles to define your similarities and differences.
Free Venn Diagram Infographic PowerPoint Template
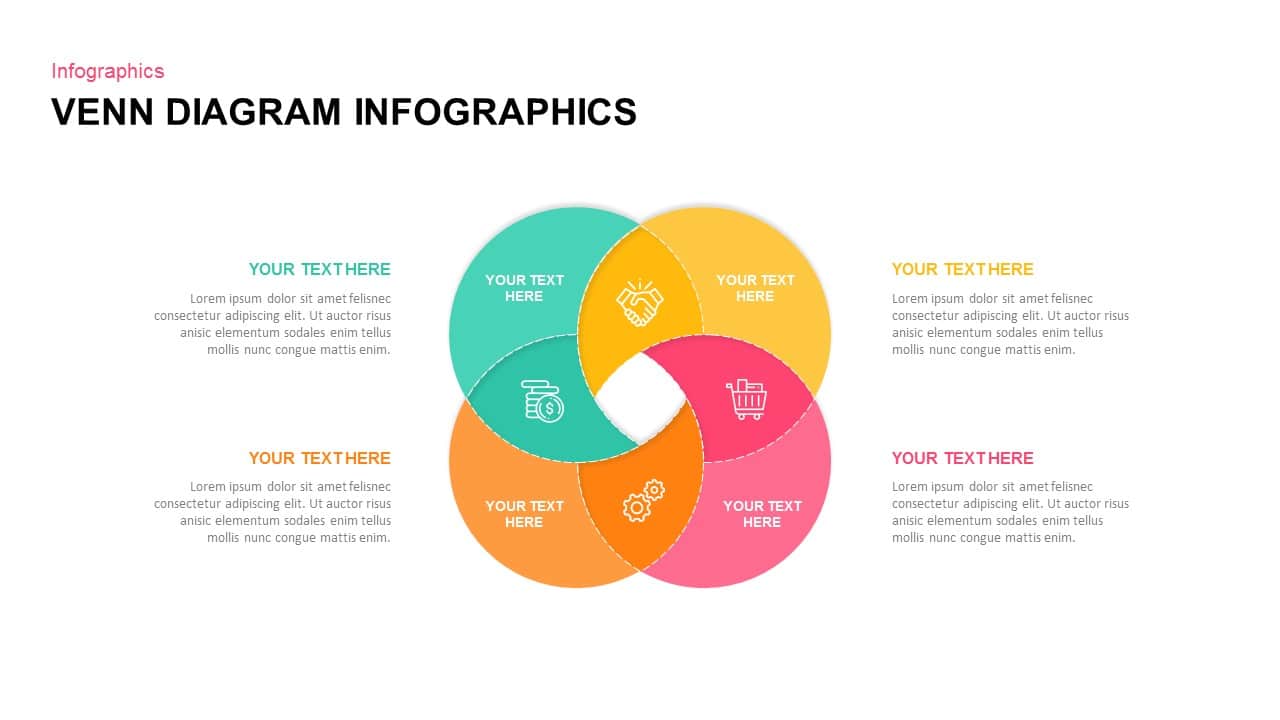
Do you want to craft a presentation that amuses your audience and lets you stand out in the crowd? Here we have Venn diagram Infographic PowerPoint templates, which come with well-balanced layouts that abet you in showcasing your message with crystal clarity.
Free Sketchy Venn Diagram for PowerPoint and Google Slides – By PresentationGo
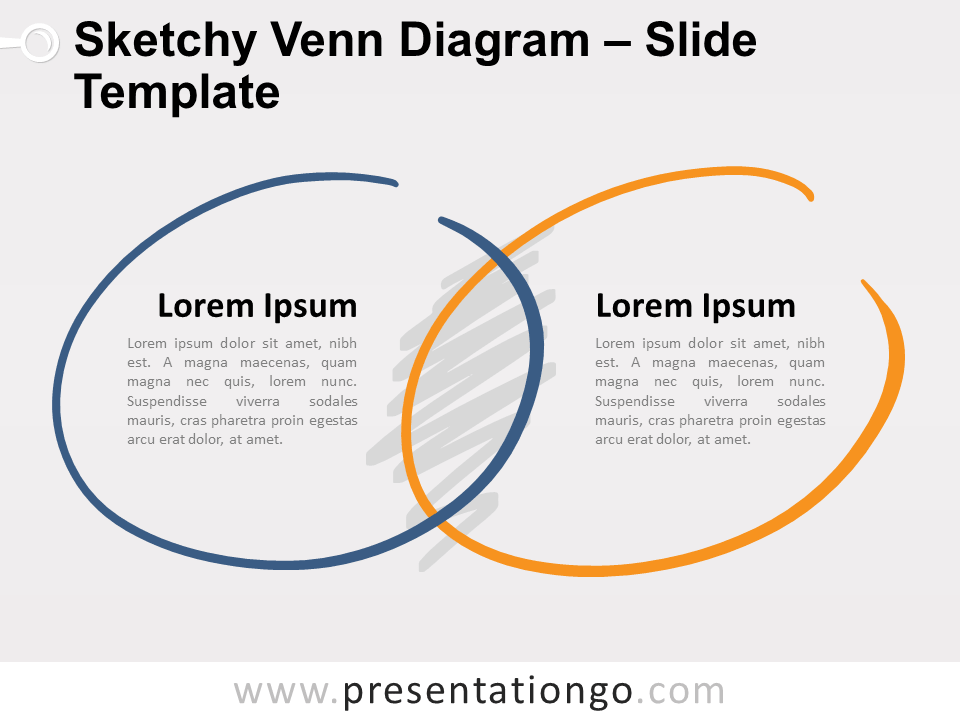
Want some artistically designed templates with modern and sophisticated layouts? One that available for free and easy to customize? Moreover, that communicates your messages effectively. Then look no further with these PowerPoint Venn Designs and get ready to design a persuasive and compelling presentation.
Circle Venn Diagram – Slidesgo
These 4 circle Venn diagrams are an excellent presentation template that guarantees to grab the audience’s eyeballs. The template has overlapping circles, which offers the finest way to show a correlation between concepts, subjects, or items.
Venn Infographic Designs – Slidesbazaar.com
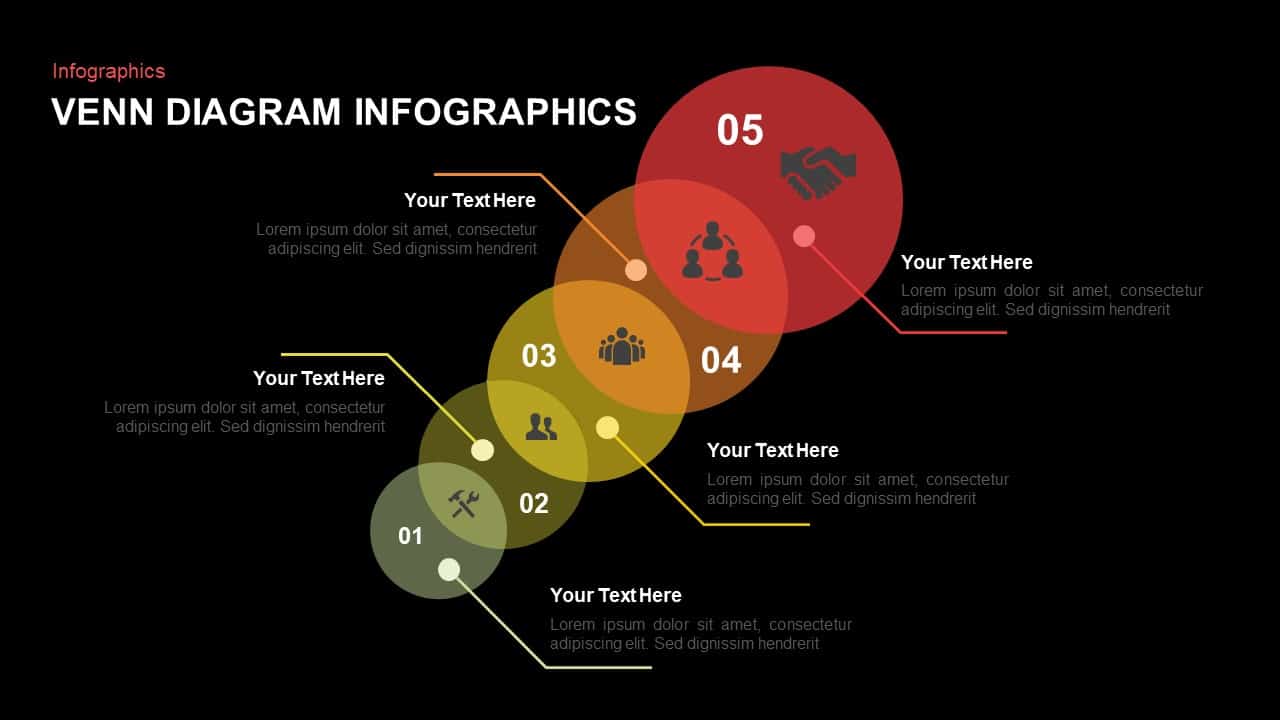
Creativity is always appreciated; think big and get ready to go bold with this awe-inspiring Venn diagram template PowerPoint. The visually interesting Venn template features 5 intersected circles, exemplary for problem-solving related presentations, presenting mathematical variables, data visualization or just demonstrating the elements of groups or set.
IKIGAI PowerPoint Template by Slidebazaar
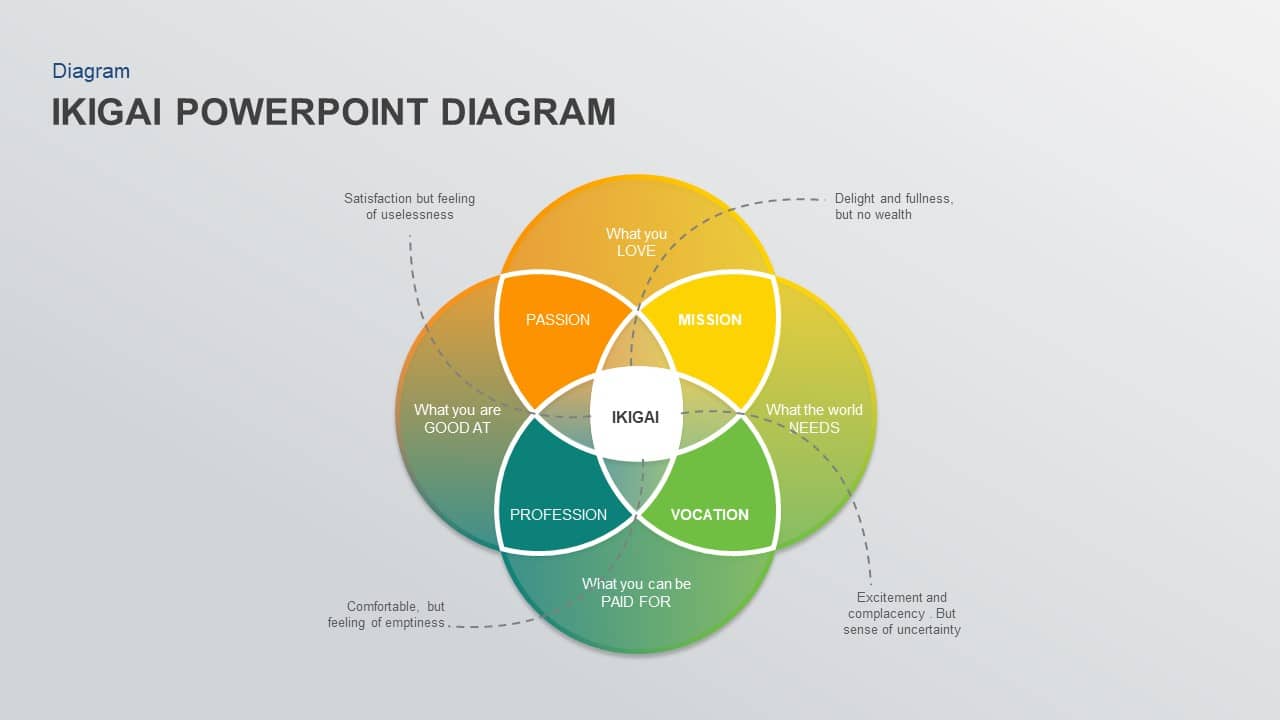
Download these IKIGAI Venn Design PowerPoint templates for motivational and brainstorming related sessions. IKIGAI is a Japanese word that means “reasons for being.” It aims to bring a meaningful direction to one’s life. To escape futility, one needs to be engaged and self-motivated. Use these IKIGAI PowerPoint templates to encourage the audience to stay.
Free Venn Diagram PowerPoint Template – By Slidehunter
Venn diagrams are popularly being used to show the similarity between elements. In the corporate sector, Van diagrams showcase analysis such as market analysis, brand positioning, competitor analysis, and much more. Not only it makes the data-visualization easier, but super-impressive.
Simple Free Venn PowerPoint Diagram – 24 Slides
Use these best free Venn diagram template to project how different sets of data is related to each other. In this selection, we have incorporated eight dynamic Venn diagram models, which cater to almost every need for showcasing relations between sets.
Interactive Venn Diagrams – Hislide.io
Looking for something unique? Yet pleasing for your next presentation. Then here we have interactive Venn diagrams, which will let you display your data innovatively. Therefore, your content won’t go unnoticed.
Venn diagrams added in our selection are a perfect solution for any presentation you need to make. From business planning, product promotions, competitor analysis, and so on. There is something for everyone on our selection.
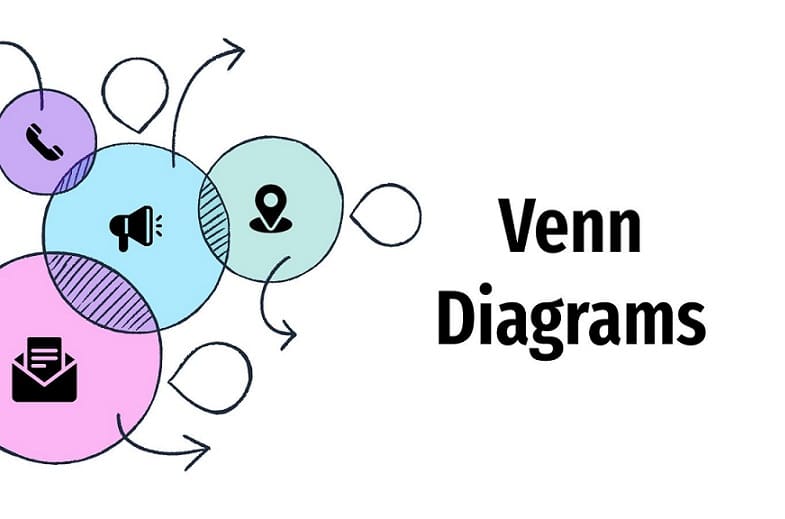
What is a Venn Diagram?
At its core, a Venn diagram is a visual tool that uses overlapping circles to illustrate the relationships, similarities, and differences between different sets of items, concepts, or groups. Each circle typically represents a distinct set or category, and the areas where they overlap (their intersections) show what those sets have in common – their similarities. Originally developed by John Venn in the 1880s, these simple yet powerful charts and graphs make complex data easy to understand at a glance. They are fundamental in fields ranging from mathematics and logic to business analysis, helping to compare and contrast information effectively.
Final Words
Now you don’t need to buy website premium subscriptions for infographic diagrams anymore. We’ve explored the best Venn diagram templates, from the fun, illustrative styles to the classic, clean blank Venn diagram layouts, giving you a powerful tool to illustrate similarities and differences effortlessly. Whether you’re working on a business report, a school project, or a creative pitch, these free Venn diagram templates are ready to download and customize. Pick your favorite template, add text, and start bringing your data to life today!
About The Author