Data Visualization Deck Template for PowerPoint and Google Slides

0


About the Template
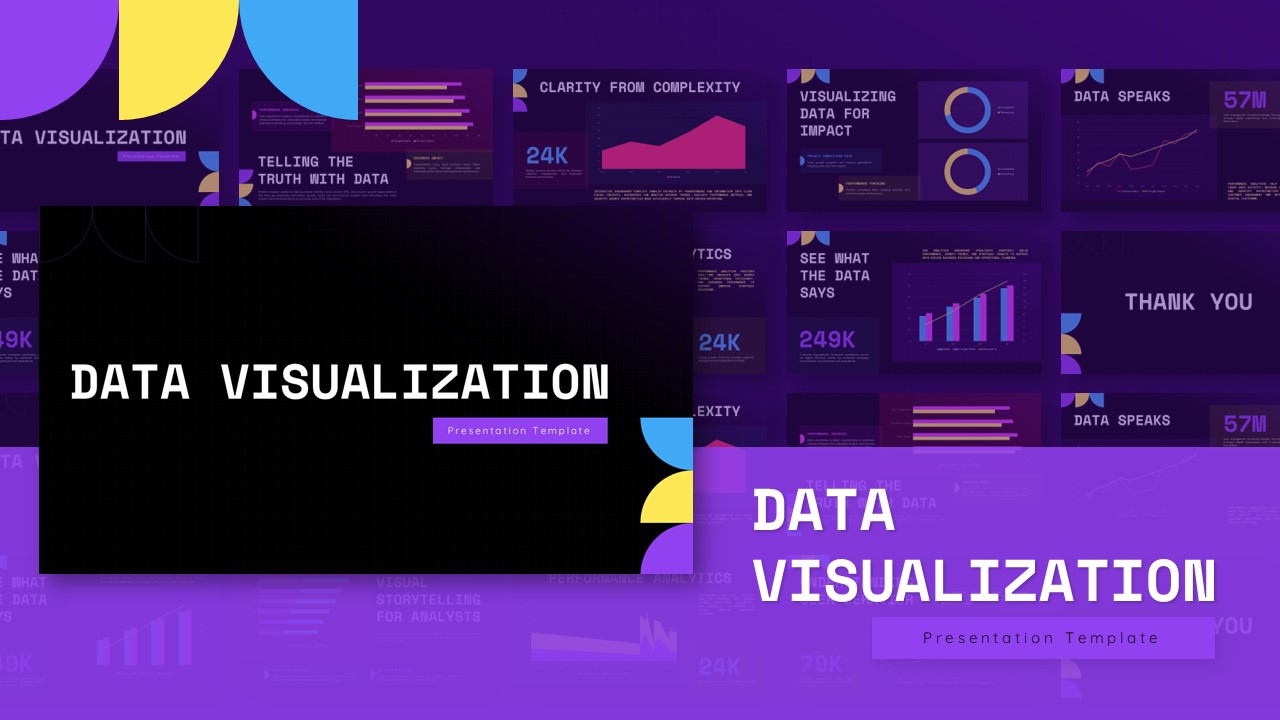
Transform Complex Numbers into Compelling Stories With these Data Visualization Diagram
Raw data can be overwhelming, but the right visual framework turns complicated metrics into a clear, actionable narrative. In today’s data-driven world, the ability to transform complex information into clear, compelling visual narratives is essential for business success. And this Data Visualization Deck Template empowers professionals to communicate insights effectively through stunning charts, graphs, and interactive dashboards.
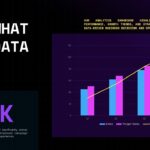
This Data Visualization PPT template features a modern dark theme with vibrant accent colors including purple, yellow, and blue geometric elements that create visual interest while maintaining professional credibility. Here you will find multiple data visualization charts—including bar charts, line charts, pie charts, and more—that make your data presentation much more impactful and interesting.
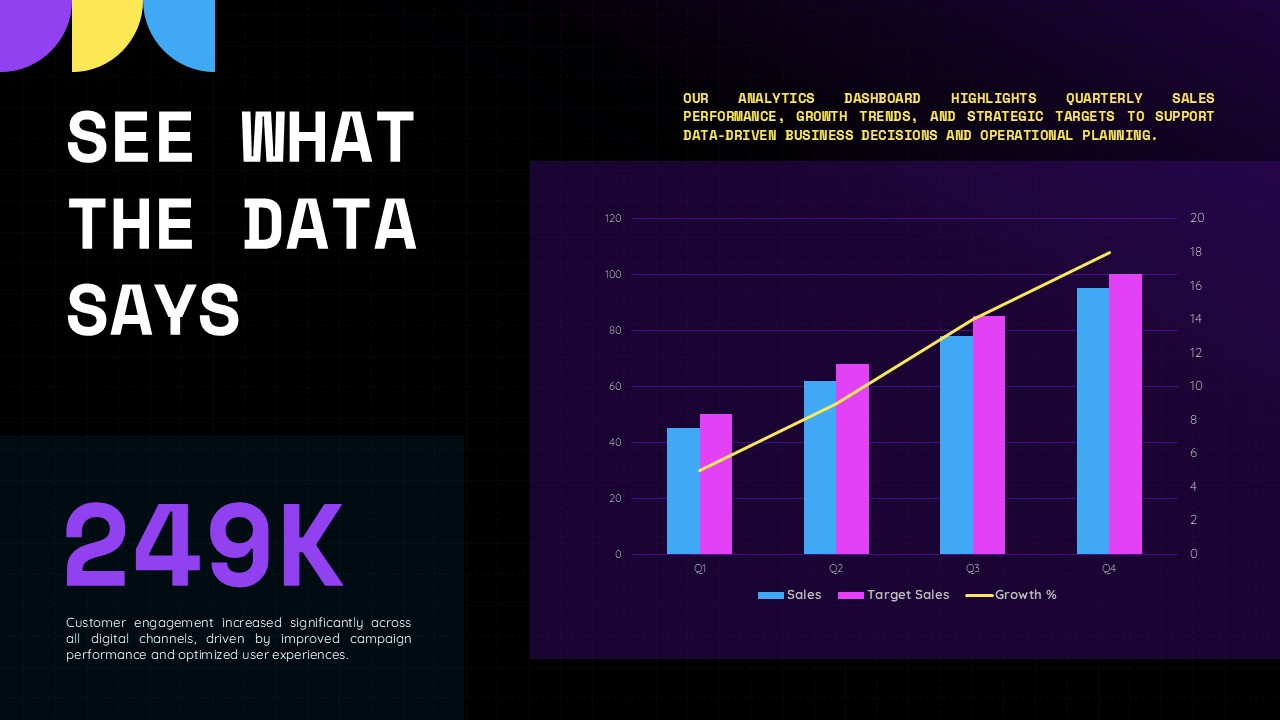
Designed with a sleek, high-contrast dark background and vibrant neon accents, this business pitch deck provides the perfect visual tools to make your statistics pop off the screen. Whether you are reporting quarterly sales targets, tracking user engagement, or comparing operational efficiency, this deck ensures your numbers take center stage without putting your audience to sleep. Ultimate resource for analysts, marketers, and business leaders who need to present performance insights with maximum clarity.
Key Features of this Data Visualization PPT Template
-
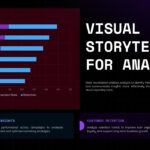
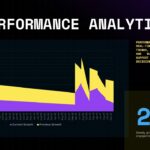
Diverse Chart Selection The template includes a wide variety of editable visual formats—such as layered line graphs, horizontal bar charts, dynamic area charts, and donut charts—ensuring you always have the right tool for your specific dataset.
-
High-Contrast Dark Theme Designed with a modern, deep dark background paired with vibrant neon accents (electric blue, yellow, purple, and pink), this aesthetic guarantees that your data points immediately draw the audience’s eye and pop off the screen.
-
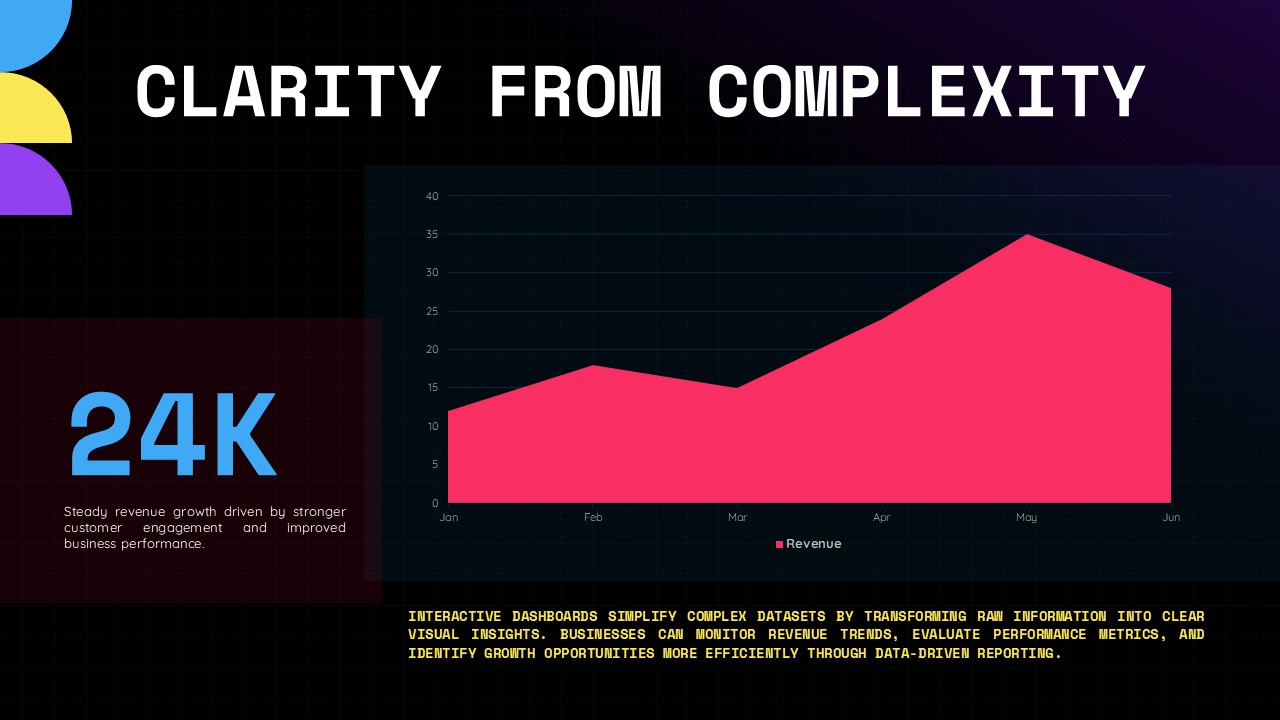
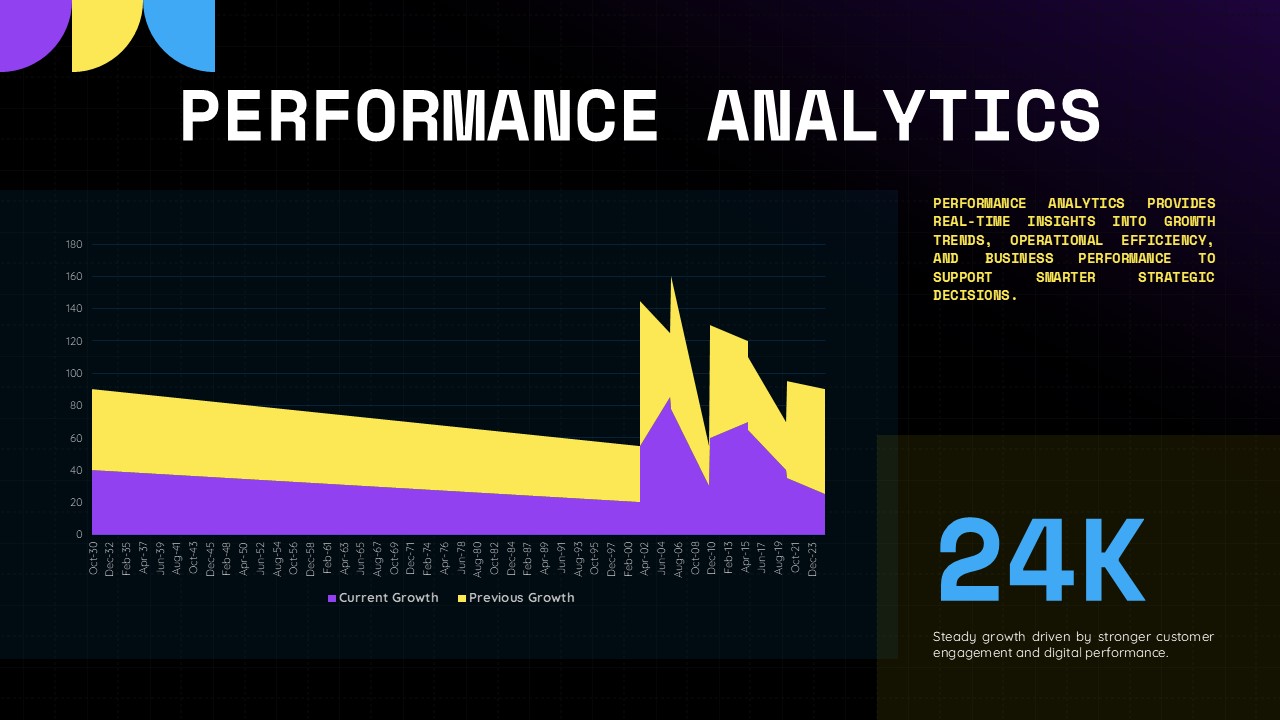
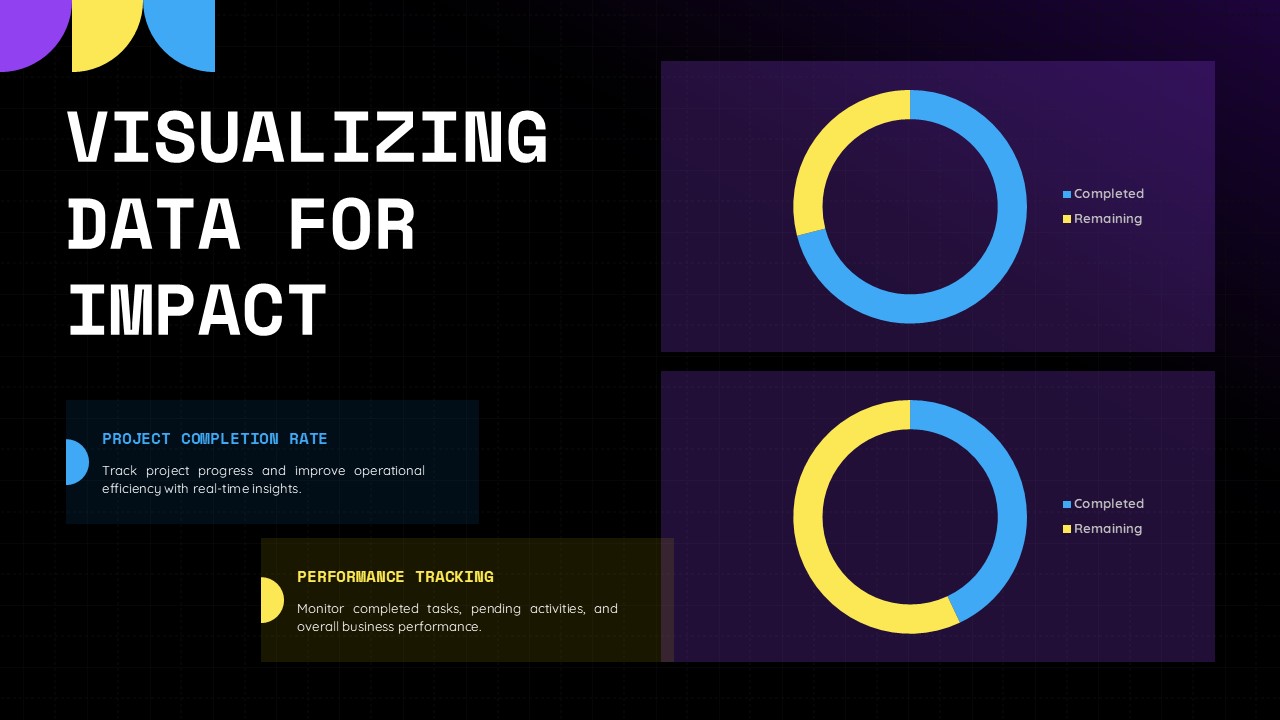
Big KPI Highlights Important metrics shouldn’t hide in a spreadsheet. The layouts feature strategically placed, oversized text blocks (like “249K” or “57M”) to boldly emphasize your most critical key performance indicators and growth numbers.
-
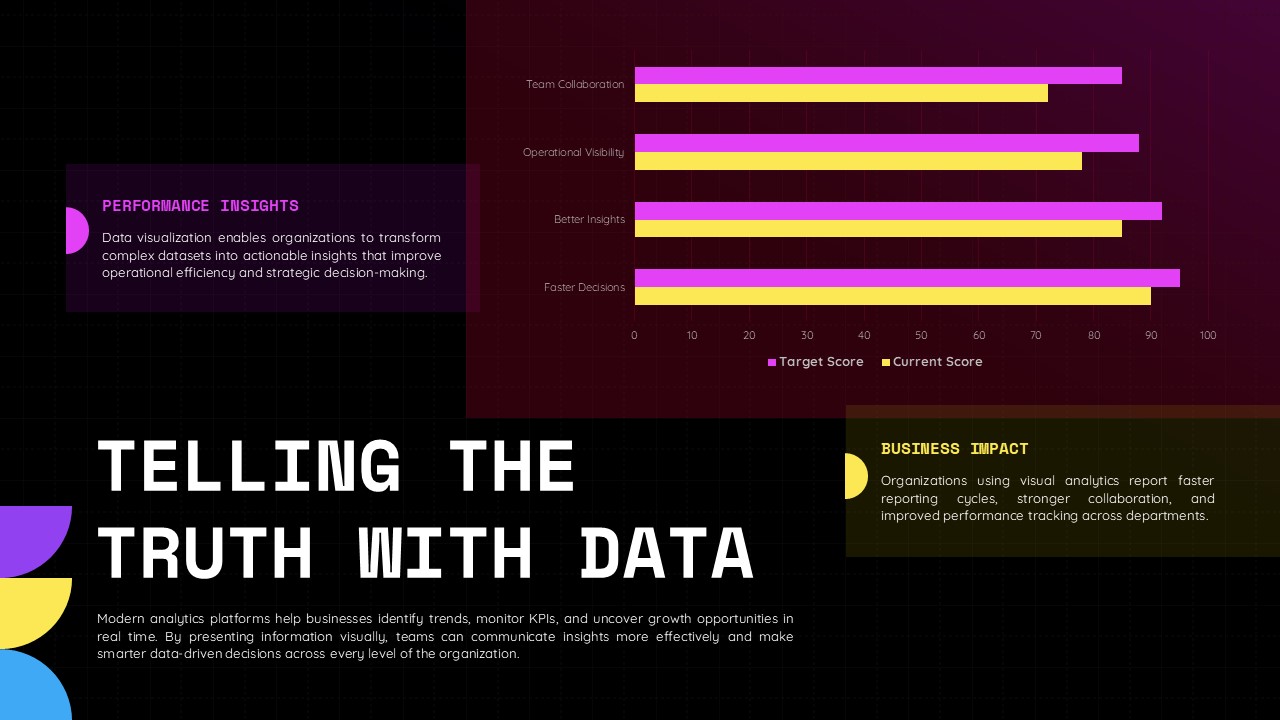
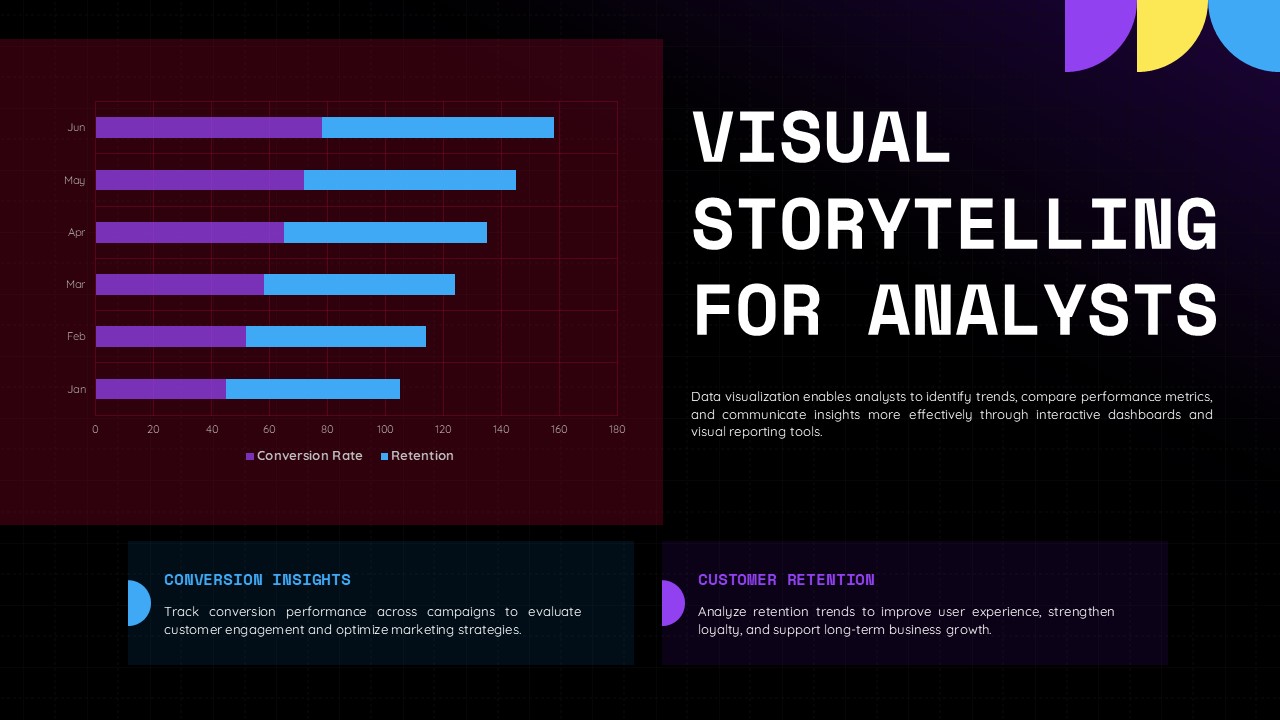
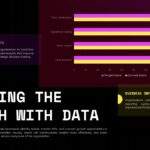
Contextual Text Blocks Numbers need a narrative. The slides include dedicated, formatted text areas (such as “Performance Insights,” “Business Impact,” and “Conversion Insights”) right next to the charts so you can easily explain the “why” behind the data.
-
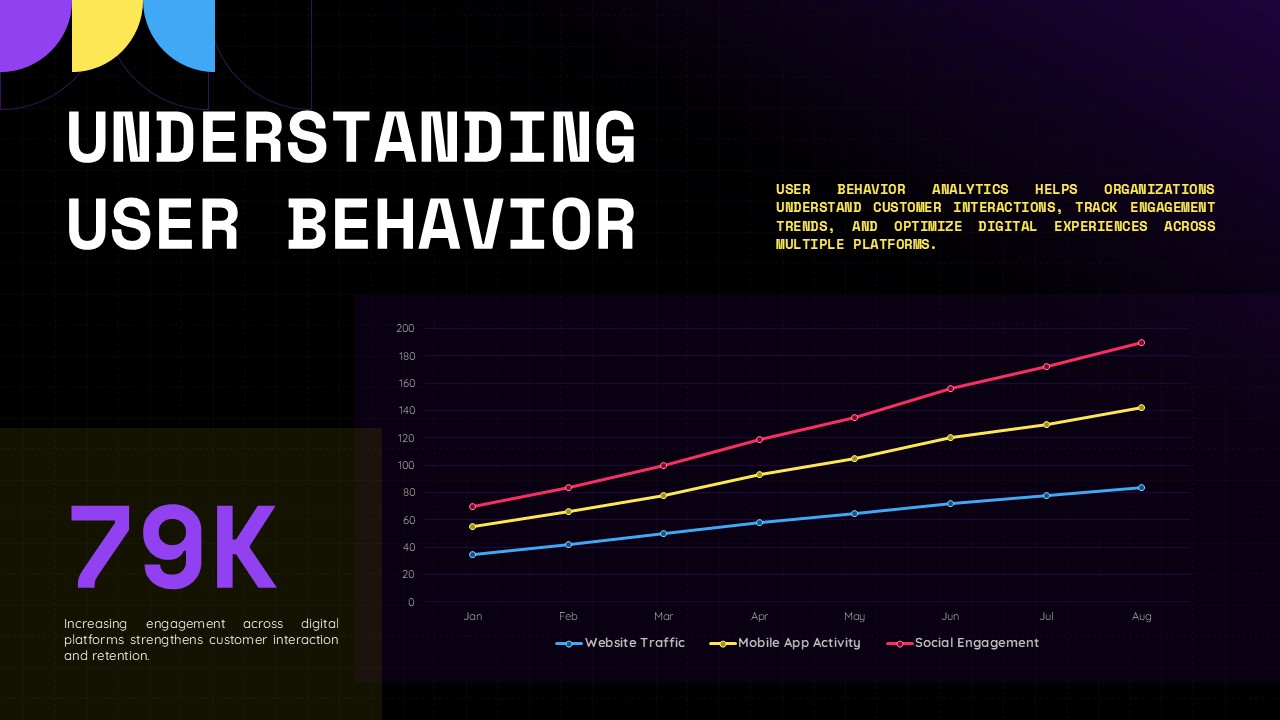
Pre-Structured Narrative Layouts Instead of generic chart slides, the deck offers ready-to-use, context-specific layouts titled “Understanding User Behavior,” “Performance Analytics,” and “Visual Storytelling for Analysts,” helping you build a logical and persuasive data presentation.
Who Should Download this Data Chart Template
-
Data Analysts and Researchers Perfect for professionals who need to translate complex, dense datasets into clear, digestible visual stories for non-technical stakeholders or executive boards.
-
SEO and Digital Marketing Managers An excellent tool for reporting on campaign performance, tracking website traffic, and visualizing user engagement metrics or conversion rates across multiple digital properties.
-
Business Strategists and Executives Ideal for high-level corporate meetings where leaders need to present quarterly sales growth, revenue trends, and operational KPIs with absolute clarity and authority.
-
Sales and Revenue Teams Provides the perfect visual layouts to showcase pipeline growth, quarterly targets, and conversion insights to leadership or potential investors.
-
Project and Operations Managers A great asset for monitoring project completion rates, operational visibility, and team performance tracking, ensuring all departments stay aligned on overarching goals.
-
Educators and Corporate Trainers Useful for breaking down performance analytics or teaching data interpretation skills to incoming staff or students in an engaging, visually stimulating format.
Presenting data doesn’t have to mean boring your audience with endless spreadsheets and bullet points. Make your numbers speak for themselves? Download the Data Visualization Deck Template and start building presentations that drive real business decisions!
Related
-

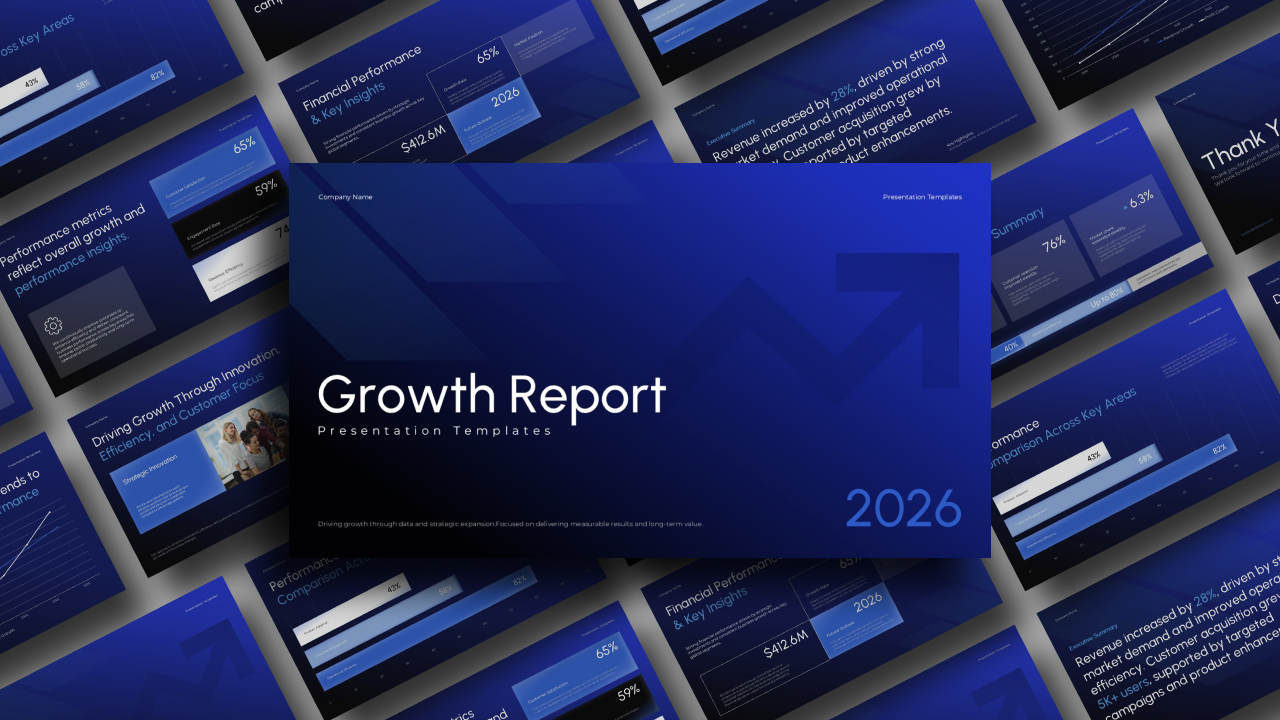
Growth Report Template for PowerPoint and Google Slides
-
Social Media Report Template PowerPoint and Google Slides
-

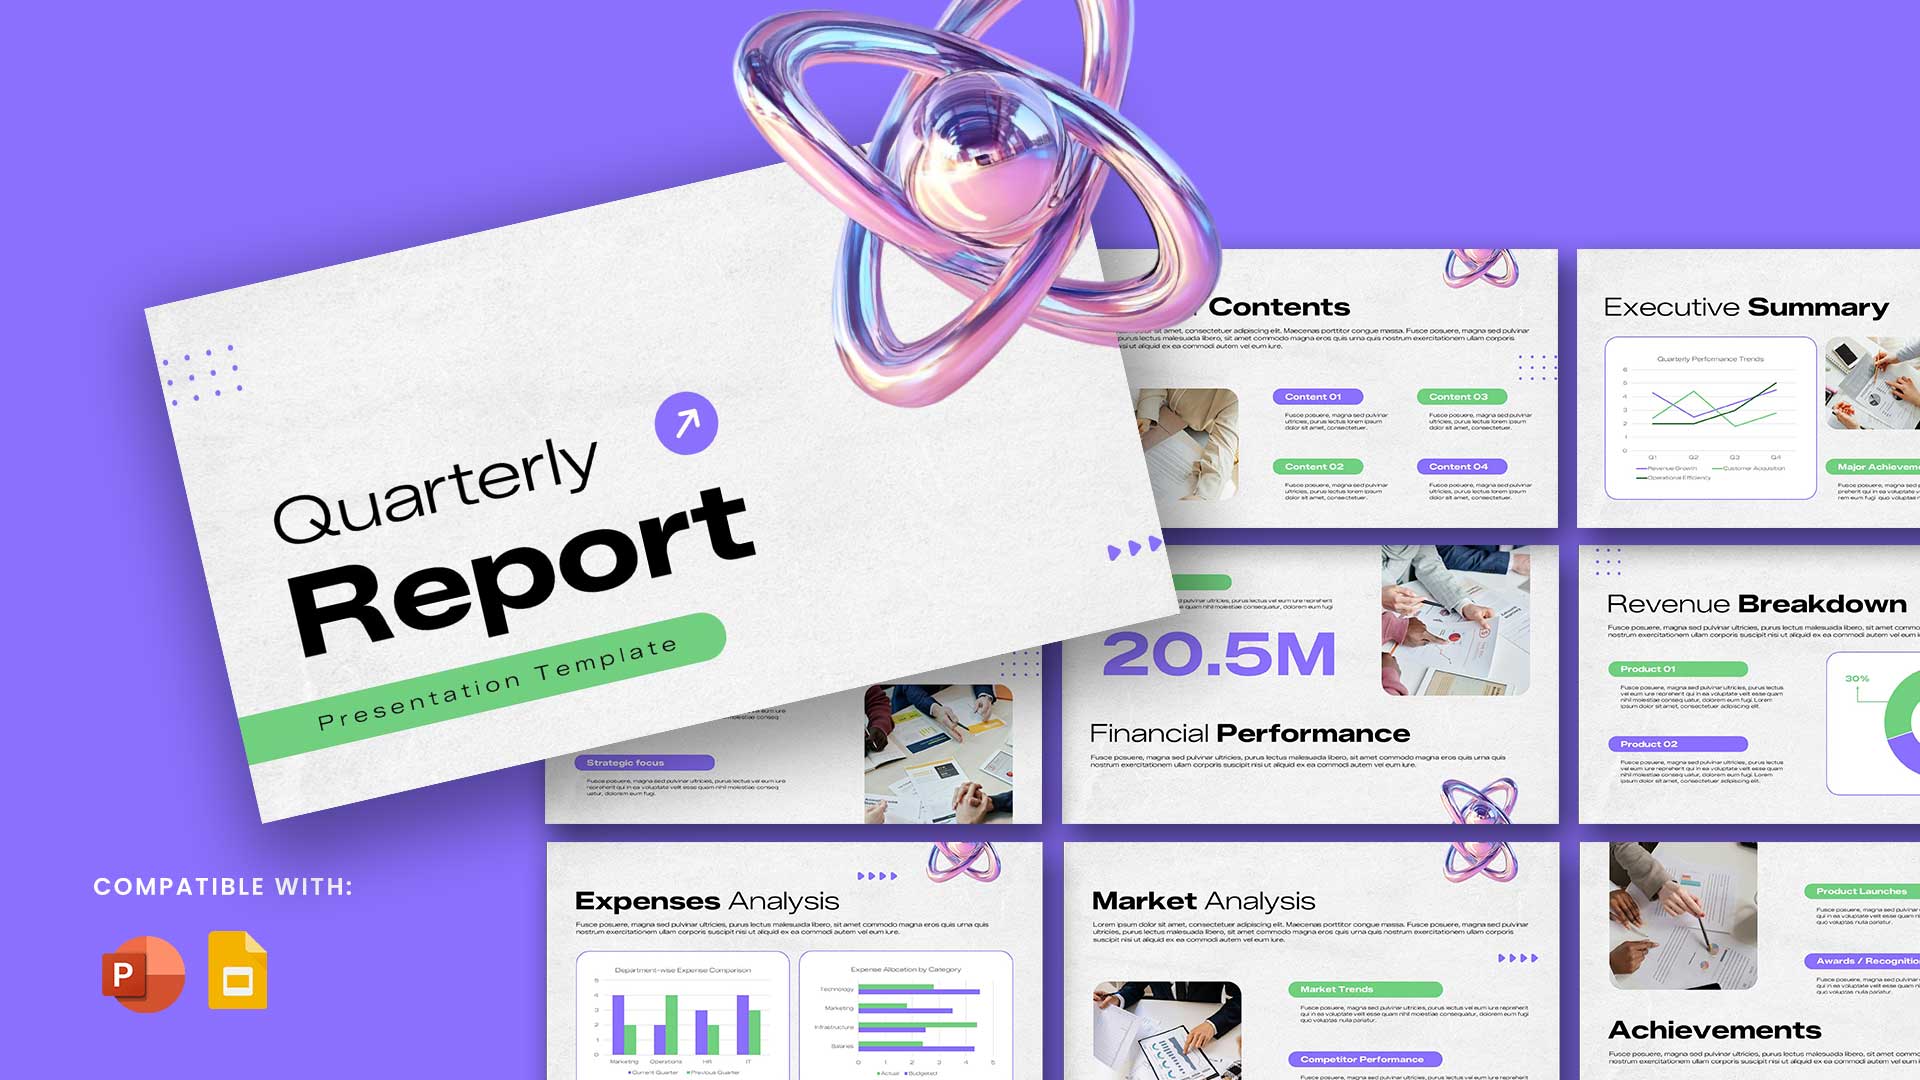
Quarterly Report Template for PowerPoint and Google Slides
-
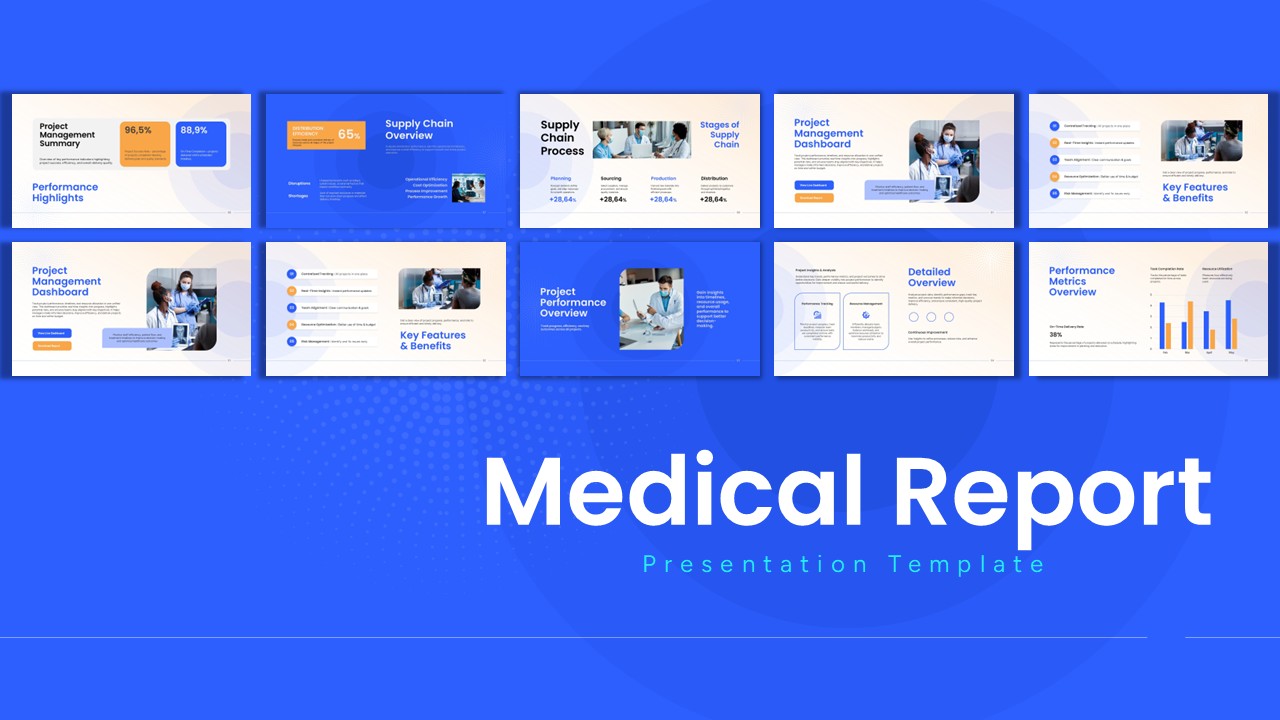
Medical Report Template for PowerPoint and Google Slides
-
Competitive Industry Report PowerPoint Template & Google Slides
-
SEO Report Template for PowerPoint and Google Slides


Are you looking for Custom Presentation Template Designs?
It is a long established fact that a reader will be distracted by the readable content of a page when or randomised words which don’t look even slightly believable