Fishbone Diagram Template for PowerPoint and Google Slides
0
About the Template
Ishikawa Diagram for Root & Cause Analysis
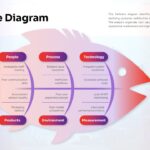
Transform your root cause analysis from a routine task into a visually compelling brainstorming session with the Colorful Fishbone Diagram Template. This root cause analysis infographic is designed to help teams pinpoint the underlying factors of complex business challenges, this template offers a modern, vibrant take on the traditional Ishikawa diagram.
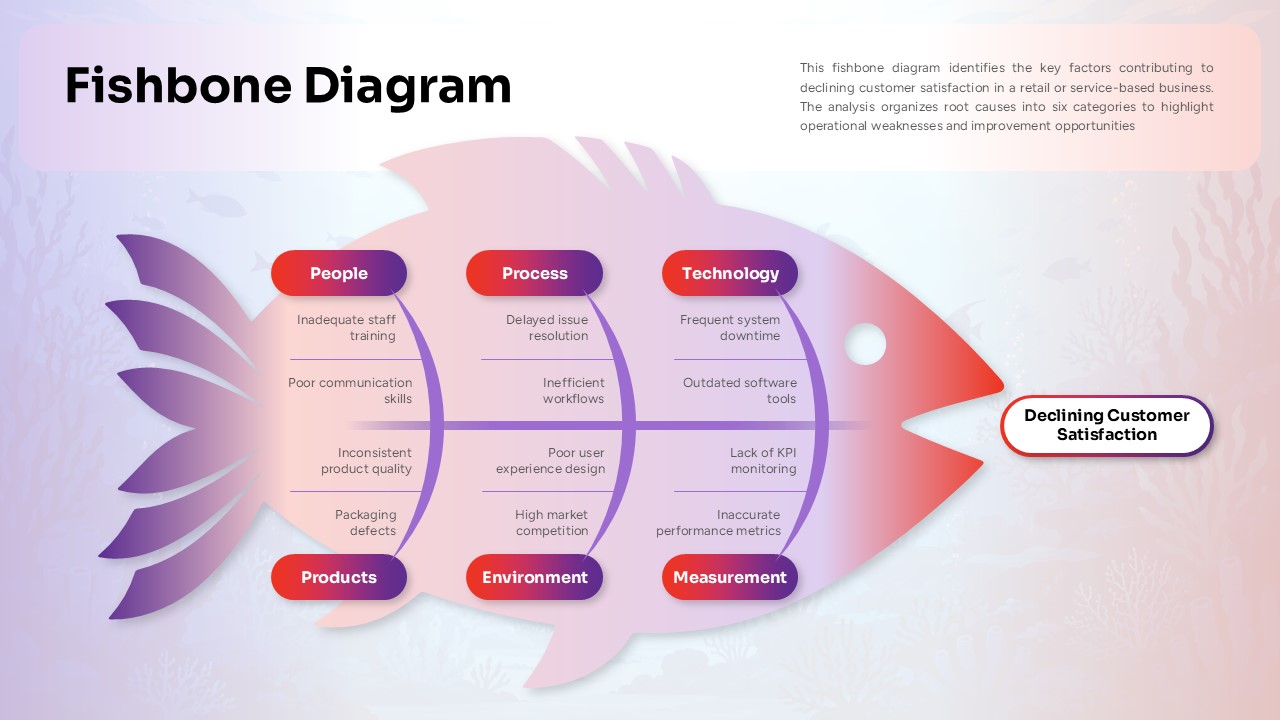
Whether you are presenting in a brightly lit boardroom or prefer a sleek, high-contrast aesthetic, this fishbone diagram deck includes both stunning light and dark mode variations. The core graphic features a beautifully stylized, gradient-filled fish shape set against a subtle, professional aquatic background, ensuring your presentation is as engaging as it is informative.
What is a Fishbone Diagram?
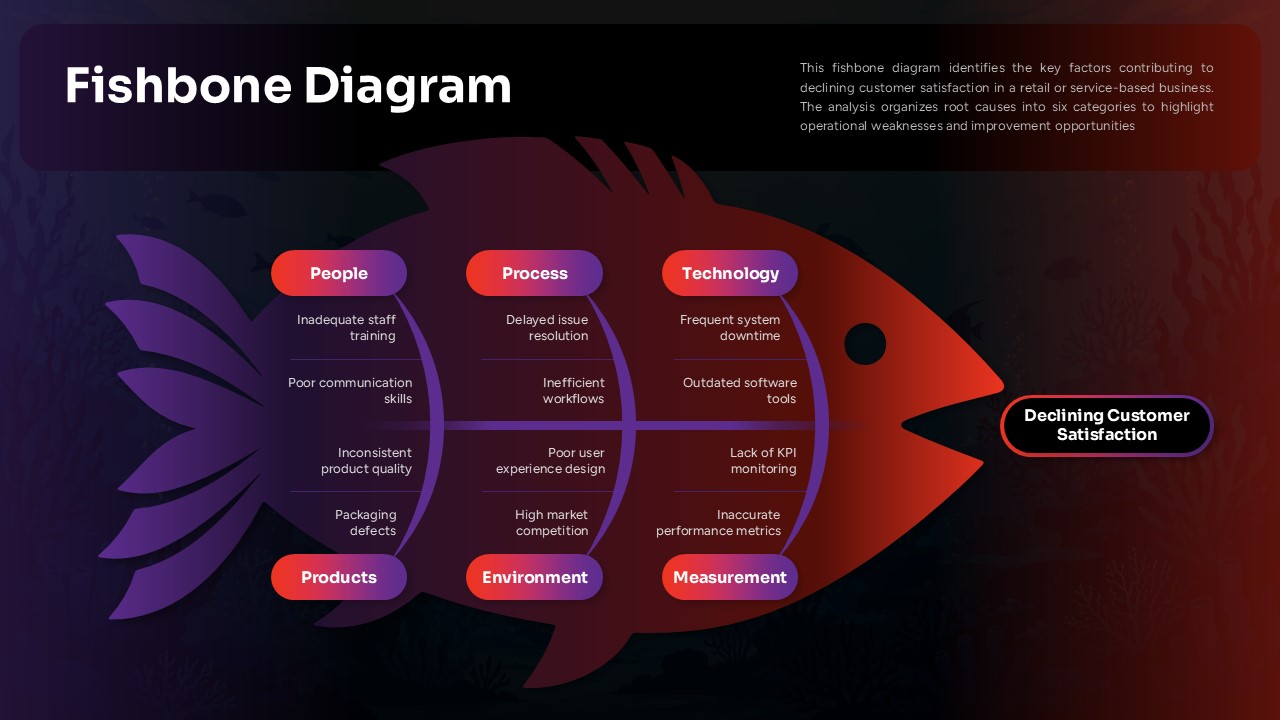
A fishbone diagram—also known as an Ishikawa or cause-and-effect diagram—is a highly effective visual tool used for root cause analysis and team brainstorming. It gets its name from its unique structure: the “head” of the fish represents the primary problem or challenge, while the extending “bones” branch out to categorize all the potential underlying causes. By breaking down complex issues into manageable categories—such as people, processes, technology, and environment—this diagram helps teams move past surface-level symptoms to pinpoint exact operational bottlenecks and develop targeted, lasting solutions.
Key Features of this Ishikawa Diagram Template
-
Structured Categorization: The diagram is logically divided into six highly adaptable “bones” or categories—People, Process, Technology, Products, Environment, and Measurement—allowing you to thoroughly break down operational weaknesses.
-
Clear Cause-and-Effect Flow: Easily map out specific root causes (like “Inadequate staff training” or “Frequent system downtime”) along the branches, all leading directly to the primary problem statement at the fish’s head.
-
Dual Aesthetic Options: Choose between the soft, airy light theme or the bold, dramatic dark theme to perfectly match your brand guidelines or presentation environment.
-
Fully Editable: Every text box, color gradient, and category label is completely customizable, allowing you to tailor the analysis to any industry problem, from declining customer satisfaction to manufacturing defects.
Whether you’re addressing customer satisfaction challenges, operational inefficiencies, or strategic obstacles, this fishbone diagram template provides the professional foundation for conducting analysis that drives real business results.
Explore our complete collection of business presentation templates to find additional tools that enhance your analytical and presentation capabilities.
Related
-

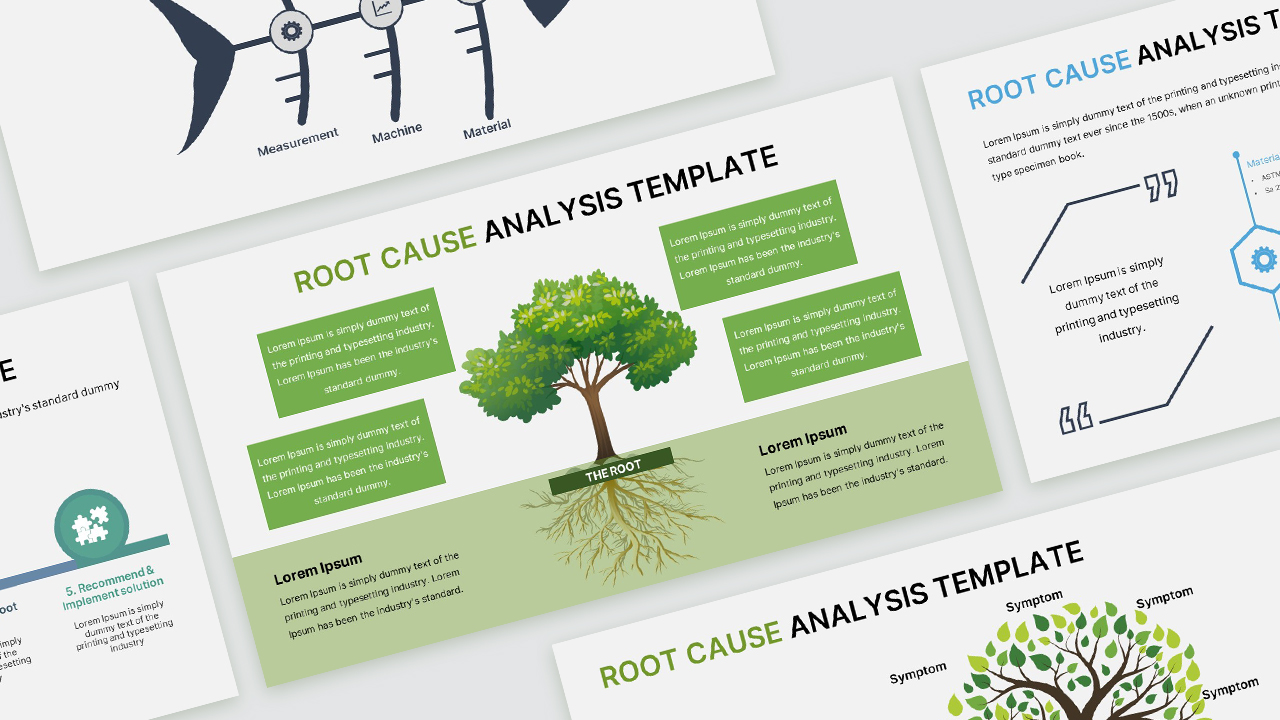
Free Root Cause Analysis Template PowerPoint & Google Slides
-
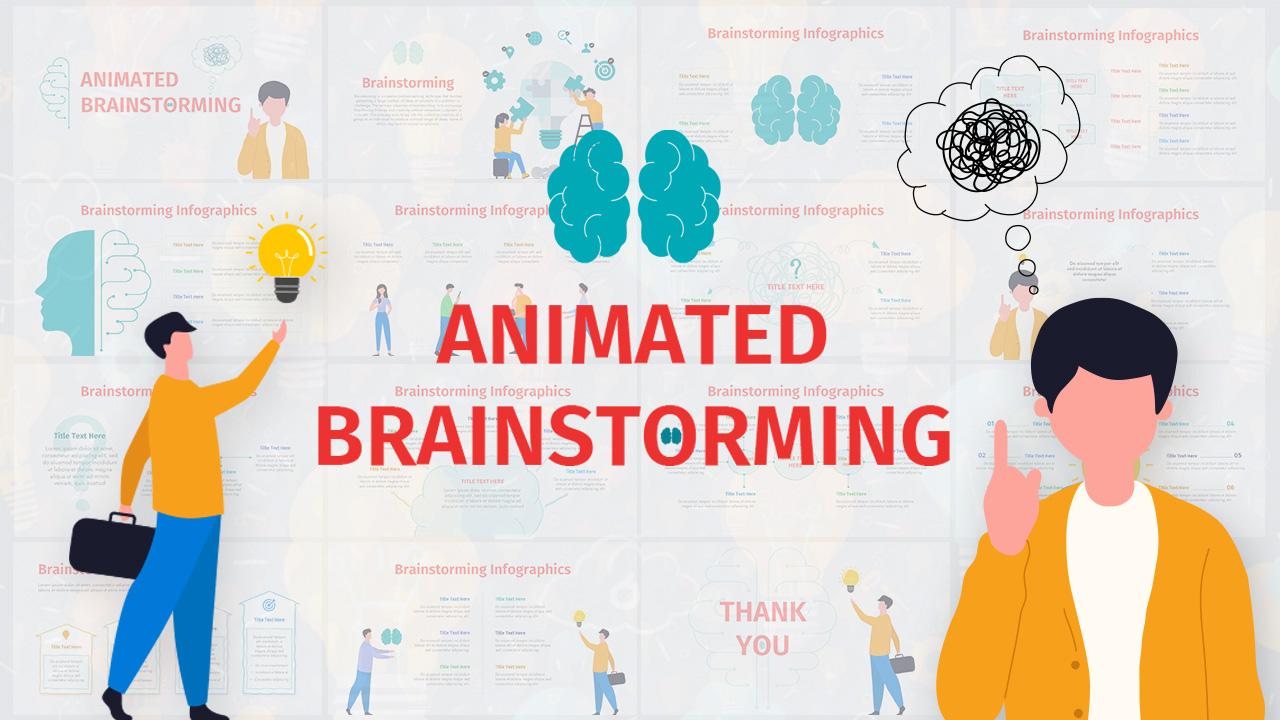
Animated Brainstorming Infographics – Free PowerPoint Template and Google Slides
-
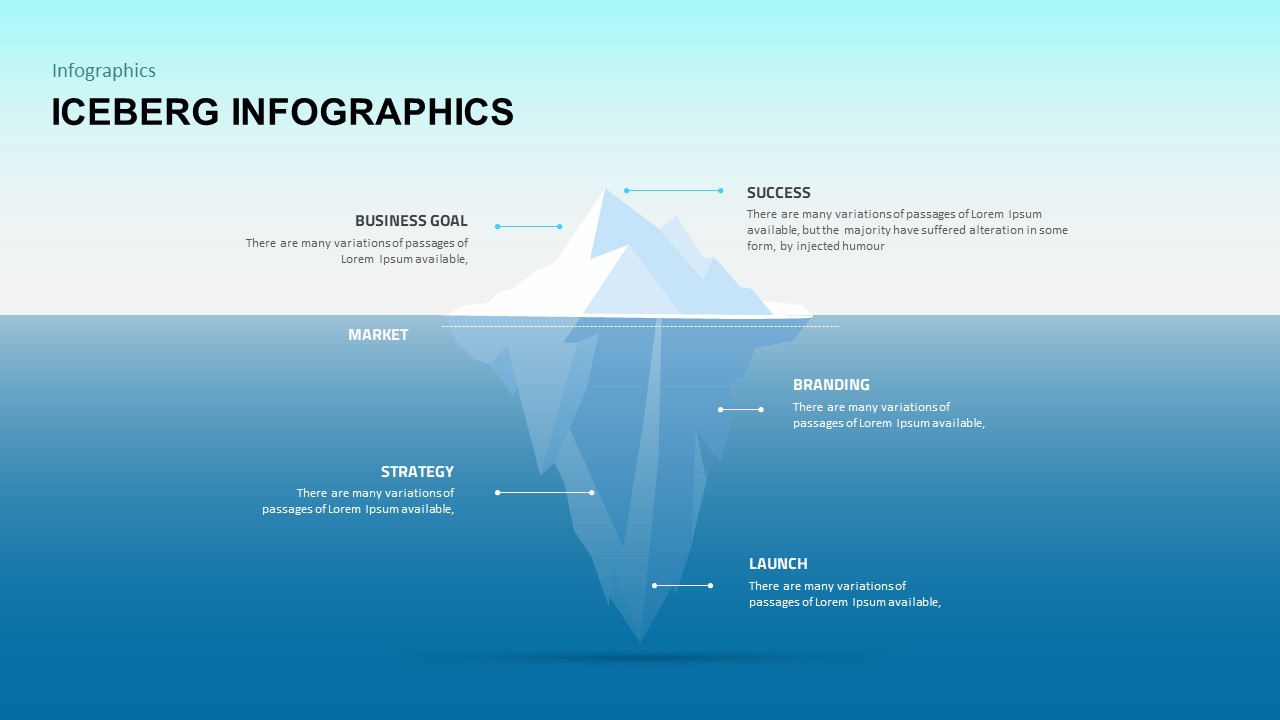
Free Iceberg Template for PowerPoint and Google Slides
-
Competitive Industry Report PowerPoint Template & Google Slides
-
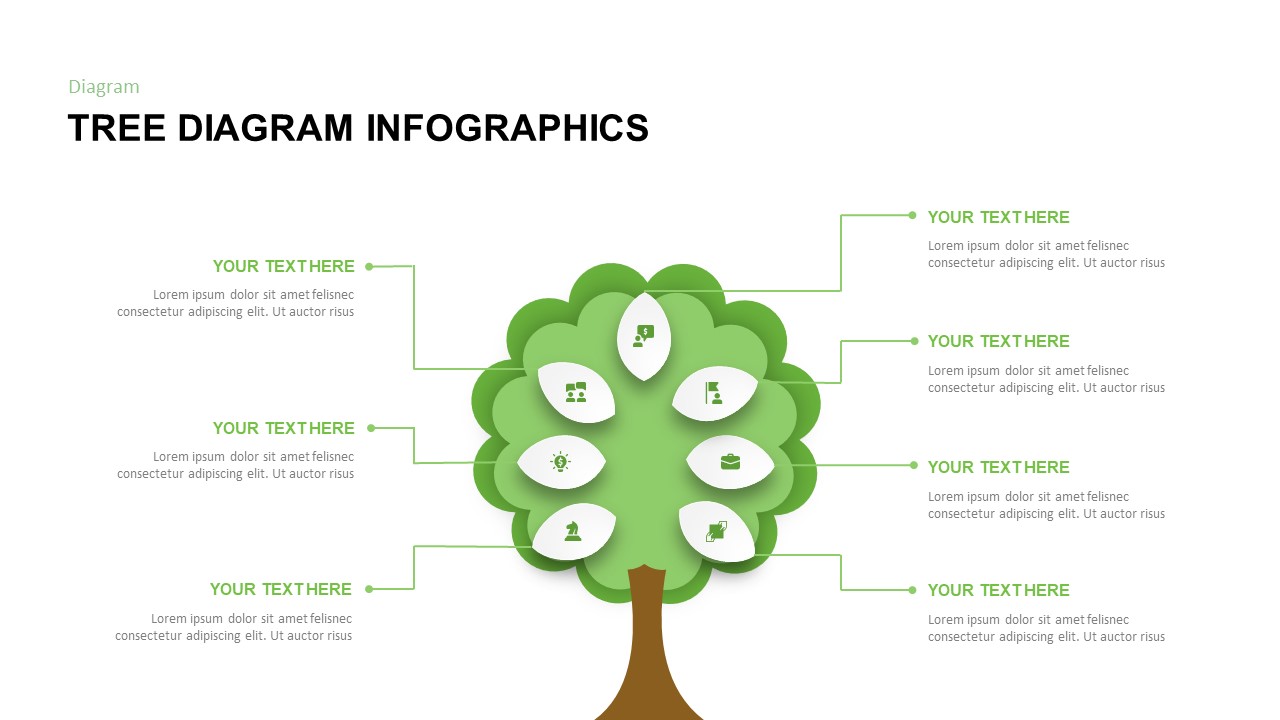
Free PowerPoint Tree Diagram Template
-
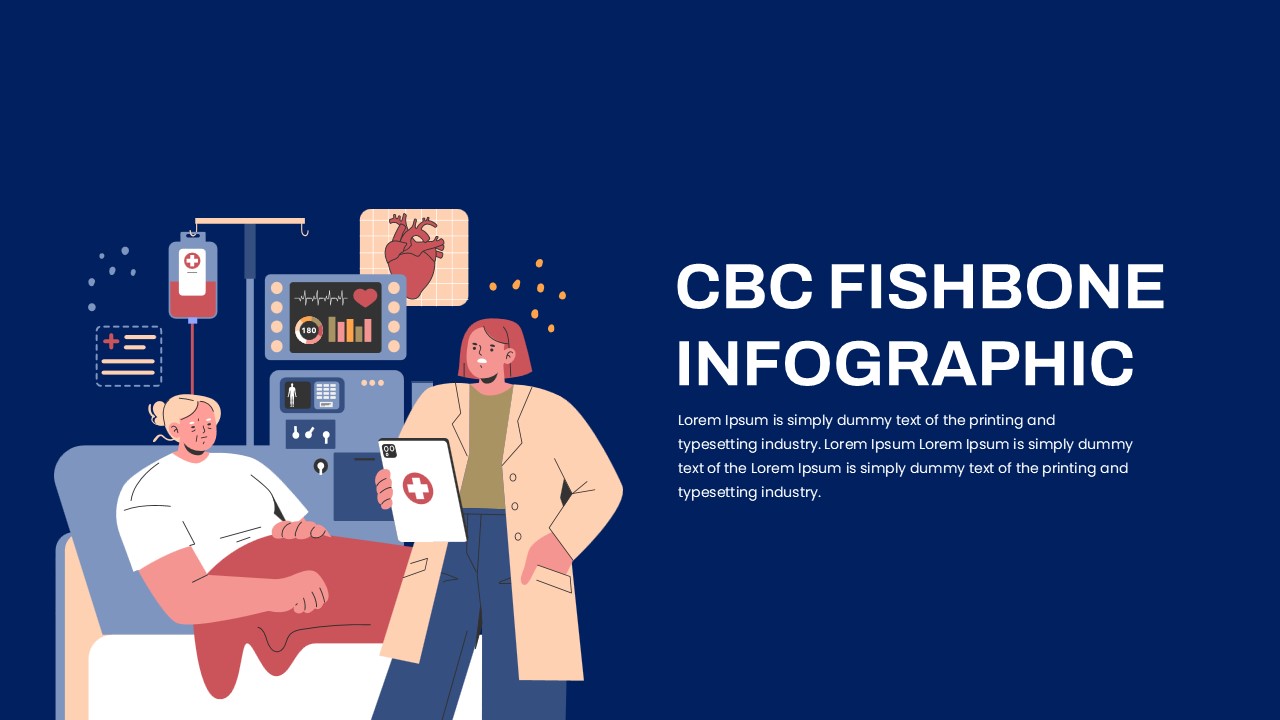
CBC Fishbone Infographic PowerPoint and Google Slides
Are you looking for Custom Presentation Template Designs?
It is a long established fact that a reader will be distracted by the readable content of a page when or randomised words which don’t look even slightly believable