Data Presentation Templates for PowerPoint, Google Slides & Canva
Make complex information easier to understand with our collection of Data Presentation Templates for PowerPoint and Google Slides. Whether you’re sharing business reports, presenting research findings, or analyzing performance metrics, these professionally designed slides help you turn raw numbers into clear visual stories. Explore editable charts, graphs, dashboards, tables, and data infographics to communicate your insights with confidence.
Filter
-

0 Upvoted
F1 Calendar 2027 Template
-
0 Upvoted
Enterprise CRM Implementation Project PowerPoint Template
-
0 Upvoted
Unbox Your Ideas PowerPoint Presentation Template
-
0 Upvoted
Podcast PowerPoint Template
-
0 Upvoted
2026 Emmy Awards Theme Template
-
0 Upvoted
Covid 19 Study Lesson PowerPoint Templ
-
0 Upvoted
Corporate Lawyers PowerPoint Template
-
0 Upvoted
Real Estate PowerPoint Presentation Template
-
0 Upvoted
Social Security Disease List Template
-
0 Upvoted
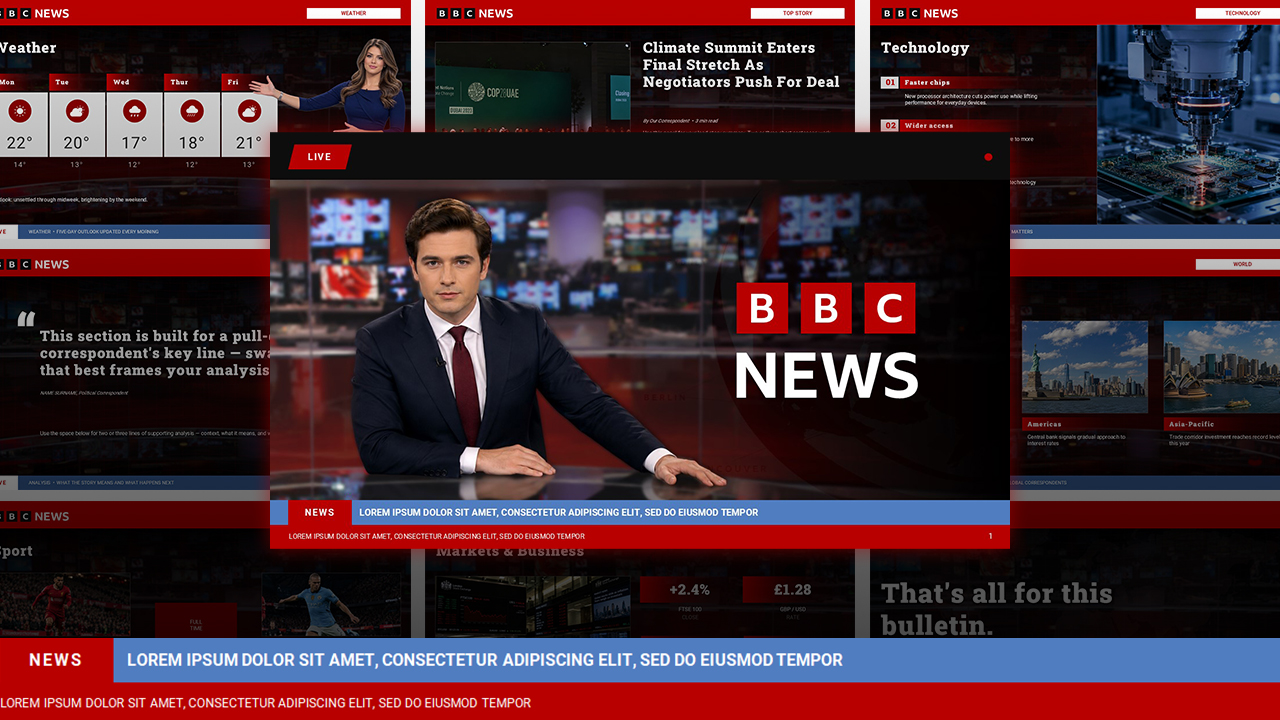
BBC News Template for PowerPoint & Canva
-
0 Upvoted
M&Ms Theme Template for PowerPoint & Canva
-
0 Upvoted
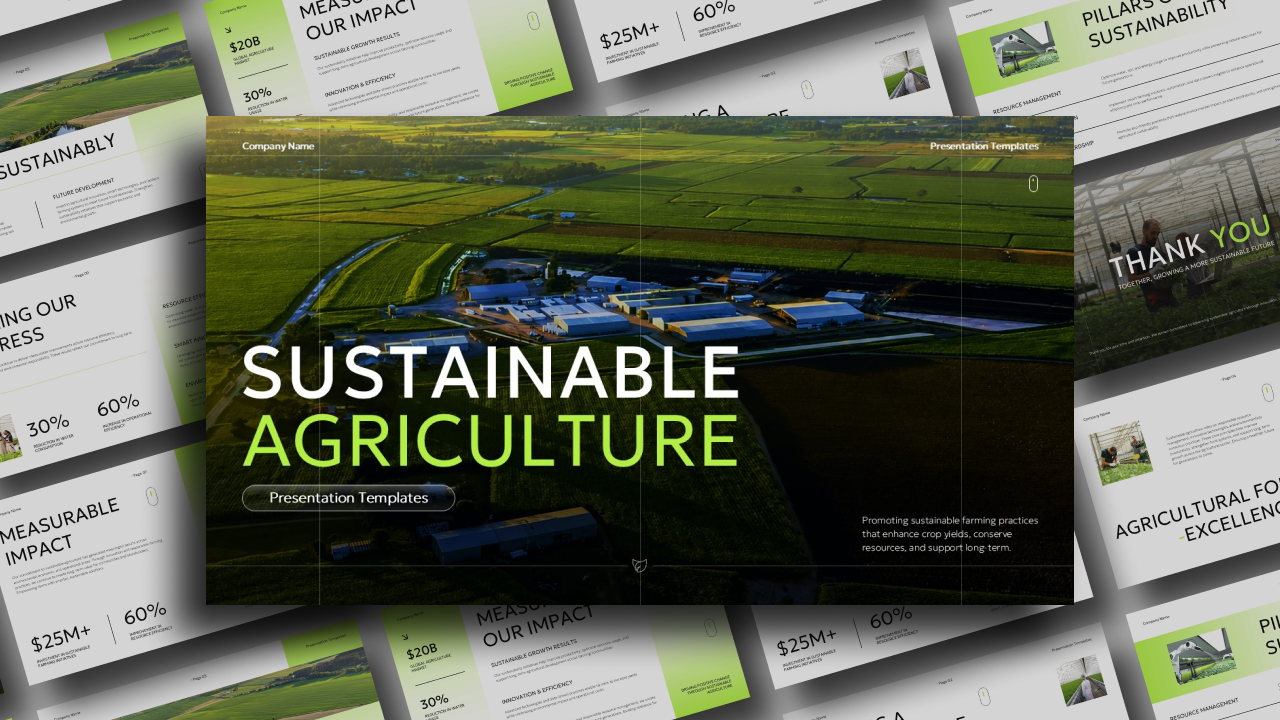
Sustainable Agriculture PowerPoint Template & Canva
-
0 Upvoted
Enterprise Risk Management Template
-
0 Upvoted
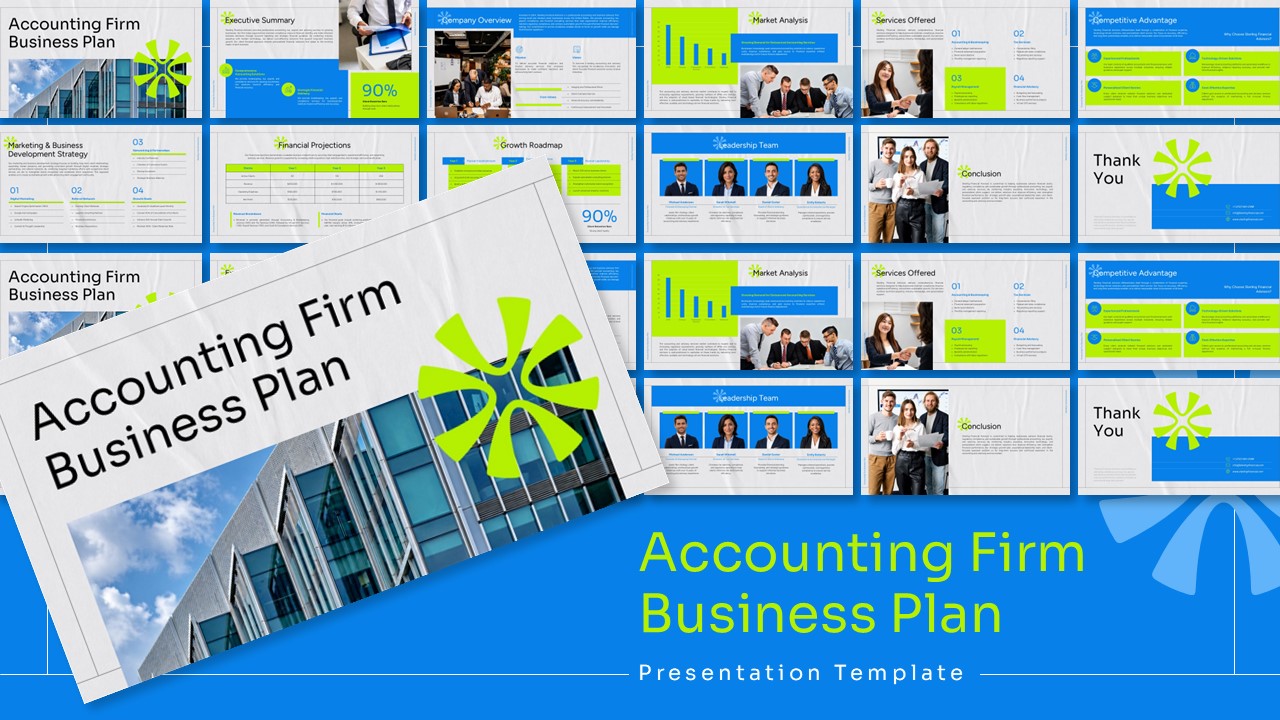
Accounting Firm Business Plan Template
-
0 Upvoted
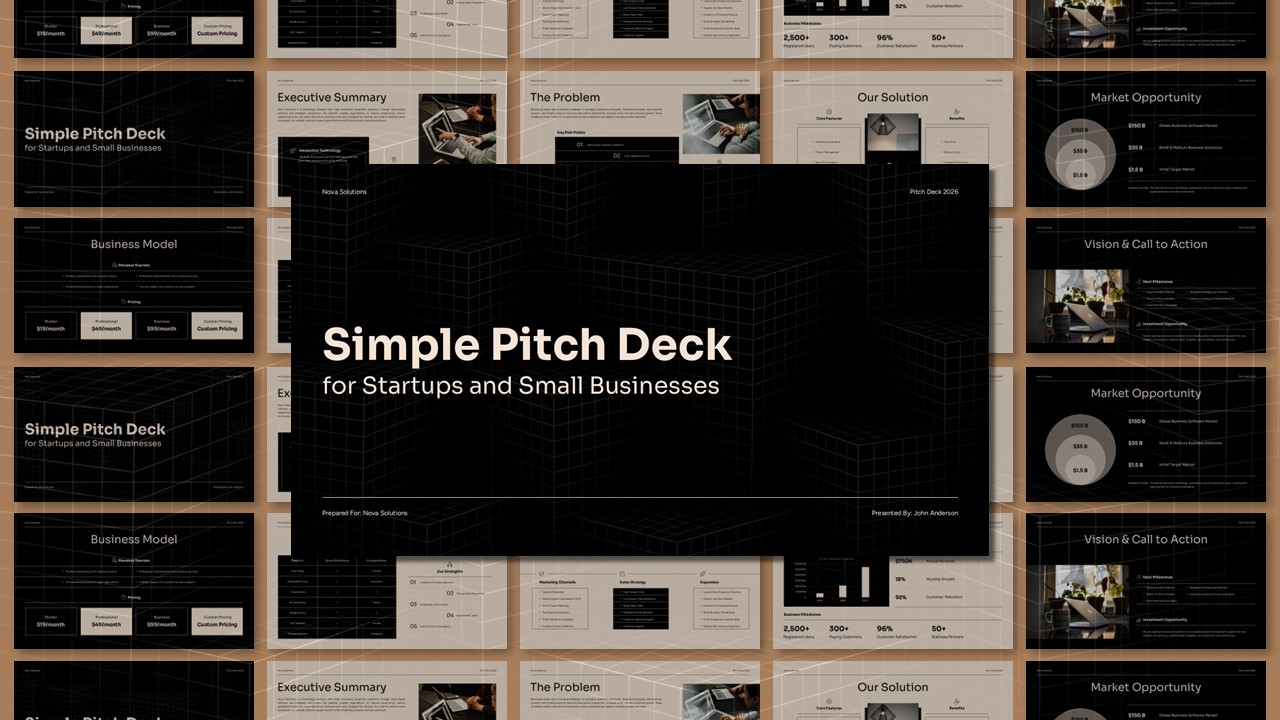
Simple Pitch Deck PowerPoint Template
-
0 Upvoted
Client Meeting Presentation Template
-

0 Upvoted
Phone Mockups Presentation Template
-
0 Upvoted
Air Quality Presentation Template Free














Data Visualization and Analysis PowerPoint Templates
Present statistics, trends, and analytical findings using visually engaging data visualization templates. Choose from a variety of slide designs featuring bar charts, pie charts, line graphs, comparison tables, percentage diagrams, and infographic layouts. These data analysis PowerPoint templates make it easier to organize information, highlight important metrics, and explain complex findings to your audience.
Create Professional Data-Driven Presentations
Our data presentation slides are suitable for business professionals, analysts, researchers, students, and educators. Use them to showcase business performance, marketing results, financial reports, survey findings, research insights, and statistical information. Customize the layouts, colors, charts, and text to match your presentation requirements and create polished reports in less time.
Frequently Asked Questions
What are data presentation templates used for?
Data presentation templates help organize and communicate information through charts, graphs, tables, dashboards, and infographics. They are useful for business reports, research presentations, financial analysis, and performance reviews.
Can I edit data presentation templates in PowerPoint and Google Slides?
Yes. You can customize supported templates by editing text, colors, shapes, charts, and other slide elements in PowerPoint and Google Slides.
What types of data visualization slides can I create?
You can create presentations featuring bar charts, pie charts, line graphs, comparison diagrams, statistical infographics, KPI dashboards, and data reporting layouts.
Are you looking for Custom Presentation Template Designs?
It is a long established fact that a reader will be distracted by the readable content of a page when or randomised words which don’t look even slightly believable