Bar Chart and Graph Template
0
About the Template
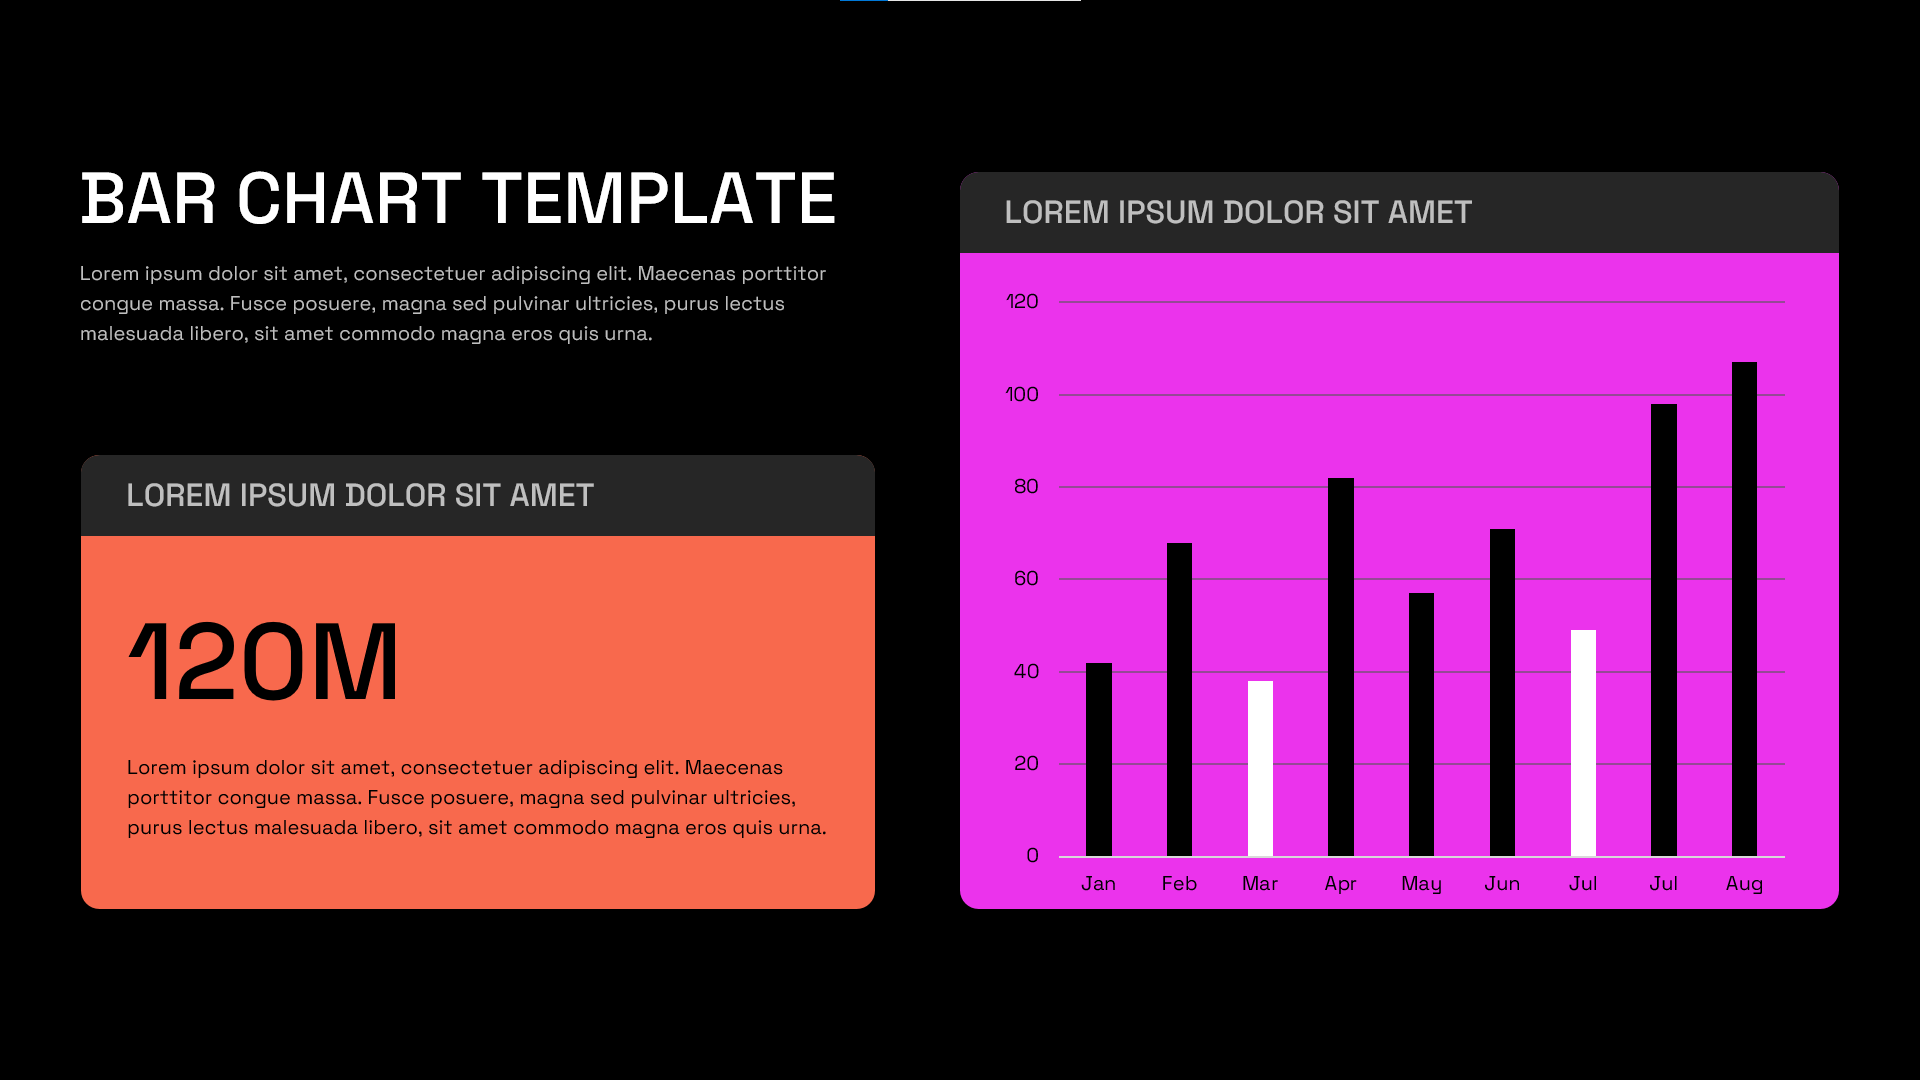
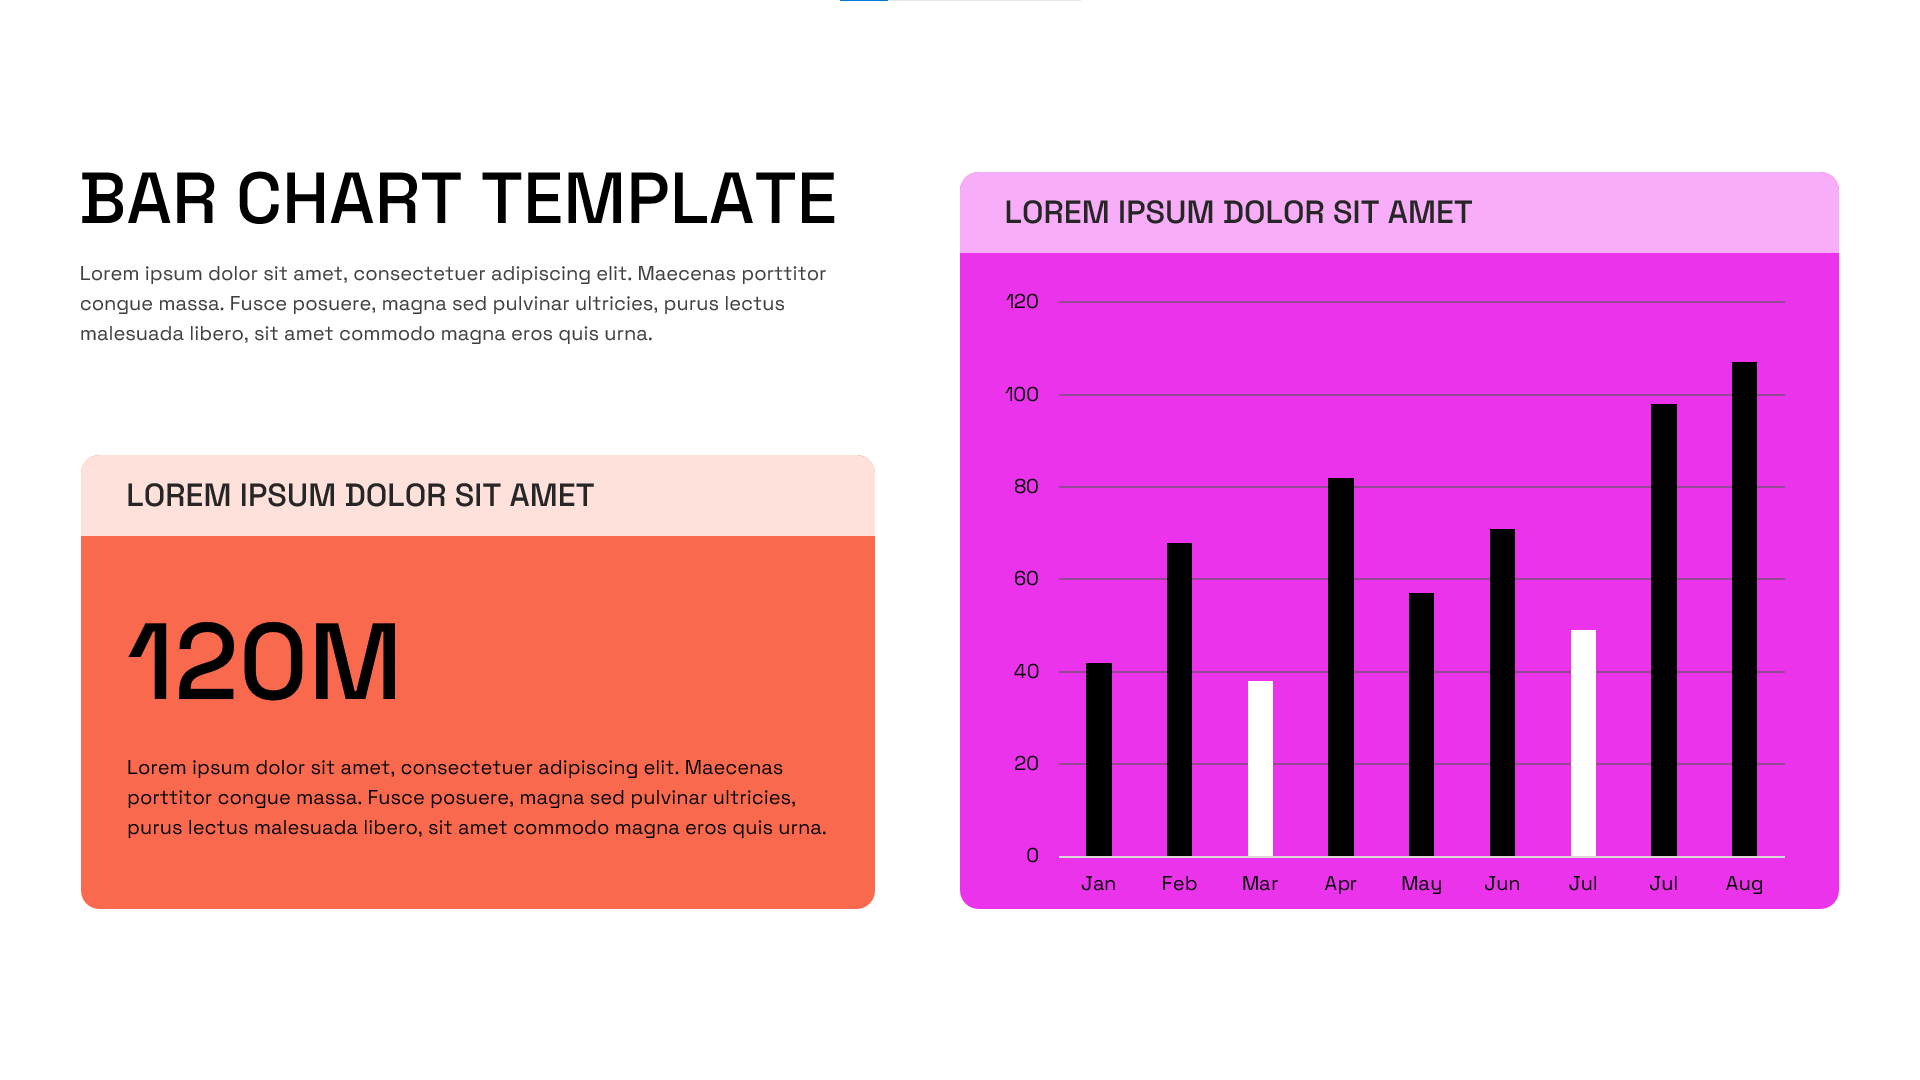
Bar Chart Template – For Easy Data Comparison
Data storytelling is only as powerful as the visuals behind it. If you are preparing a performance report, executive dashboard, or quarterly business review, you need a slide that makes your numbers impossible to ignore. This Bar Chart Template delivers exactly that, combining a striking two-column asymmetric layout with bold color blocking and high-contrast design elements that command attention from the first second your slide appears on screen.
This Bar Chart and Graph Template is engineered around that principle, placing your most important metric front and center while the bar chart provides the supporting context your audience needs to understand the bigger picture.
The dual-theme design is a particularly smart feature for professionals who present in multiple environments. Use the dark mode version for digital presentations, pitch decks, and conference stages where bold visuals stand out.
Use Case of this Bar Chart Template
- Monthly Performance Reporting: Display sales, revenue, or engagement metrics across months with a clear and visually compelling bar chart layout.
- Executive Dashboards: Present high-level KPIs to leadership teams using the bold metric card alongside trend visualization for fast decision-making.
- Quarterly Business Reviews: Summarize quarterly performance with a professional slide that balances key numbers and historical trend data.
- Marketing Analytics Presentations: Showcase campaign performance, website traffic, or conversion trends in a modern format that resonates with marketing teams.
- Investor Pitch Decks: Impress stakeholders with a polished, data-forward slide that communicates growth metrics with authority and clarity.
- Sales Team Reporting: Keep sales presentations sharp and focused by visualizing monthly targets versus actuals in a clean, readable layout.
- Agency Client Reports: Deliver client-facing performance reports with a premium dark or light design that reflects a high standard of professionalism.
No matter your industry or role, if you present data, this template will save you time and elevate the quality of your work. Explore the full range of data presentation templates on SlideChef to find the perfect visual tools for every reporting need. Download this Bar Chart Template today and make every number count.
Related
-

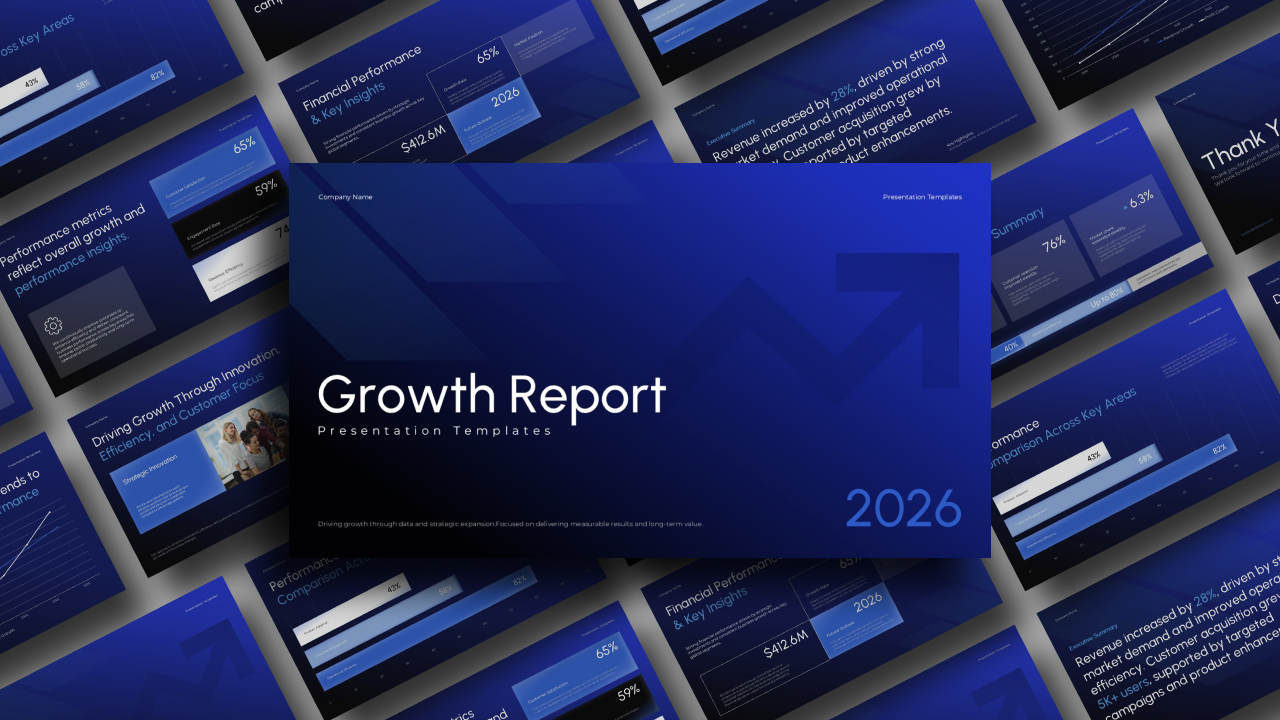
Growth Report Template for PowerPoint and Google Slides
-
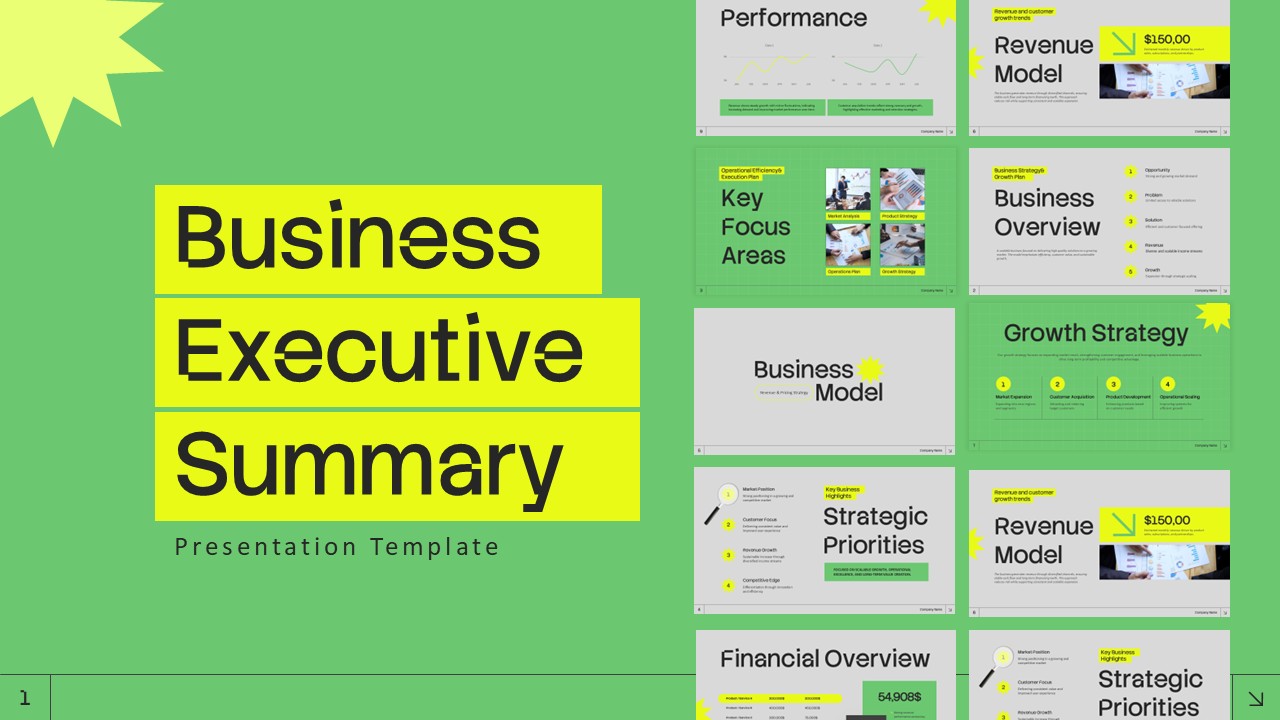
Business Executive Summary Template for PowerPoint & Google Slides
-
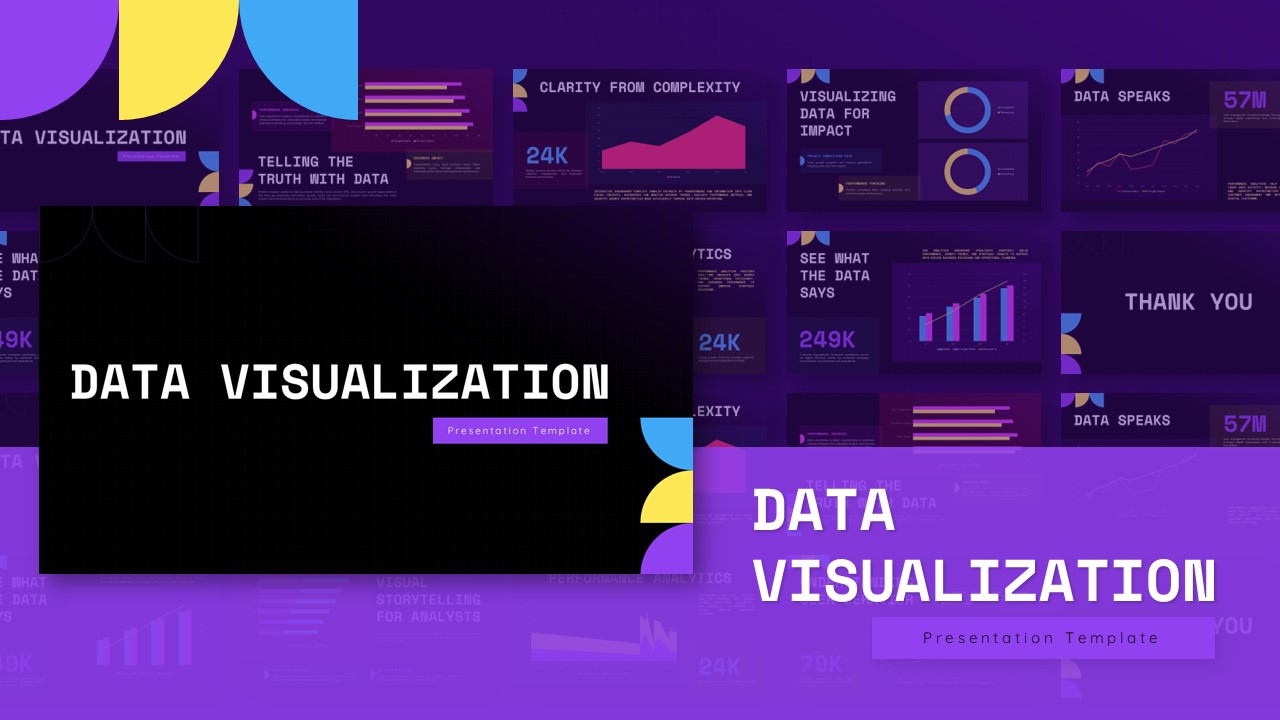
Data Visualization Deck Template for PowerPoint and Google Slides
-

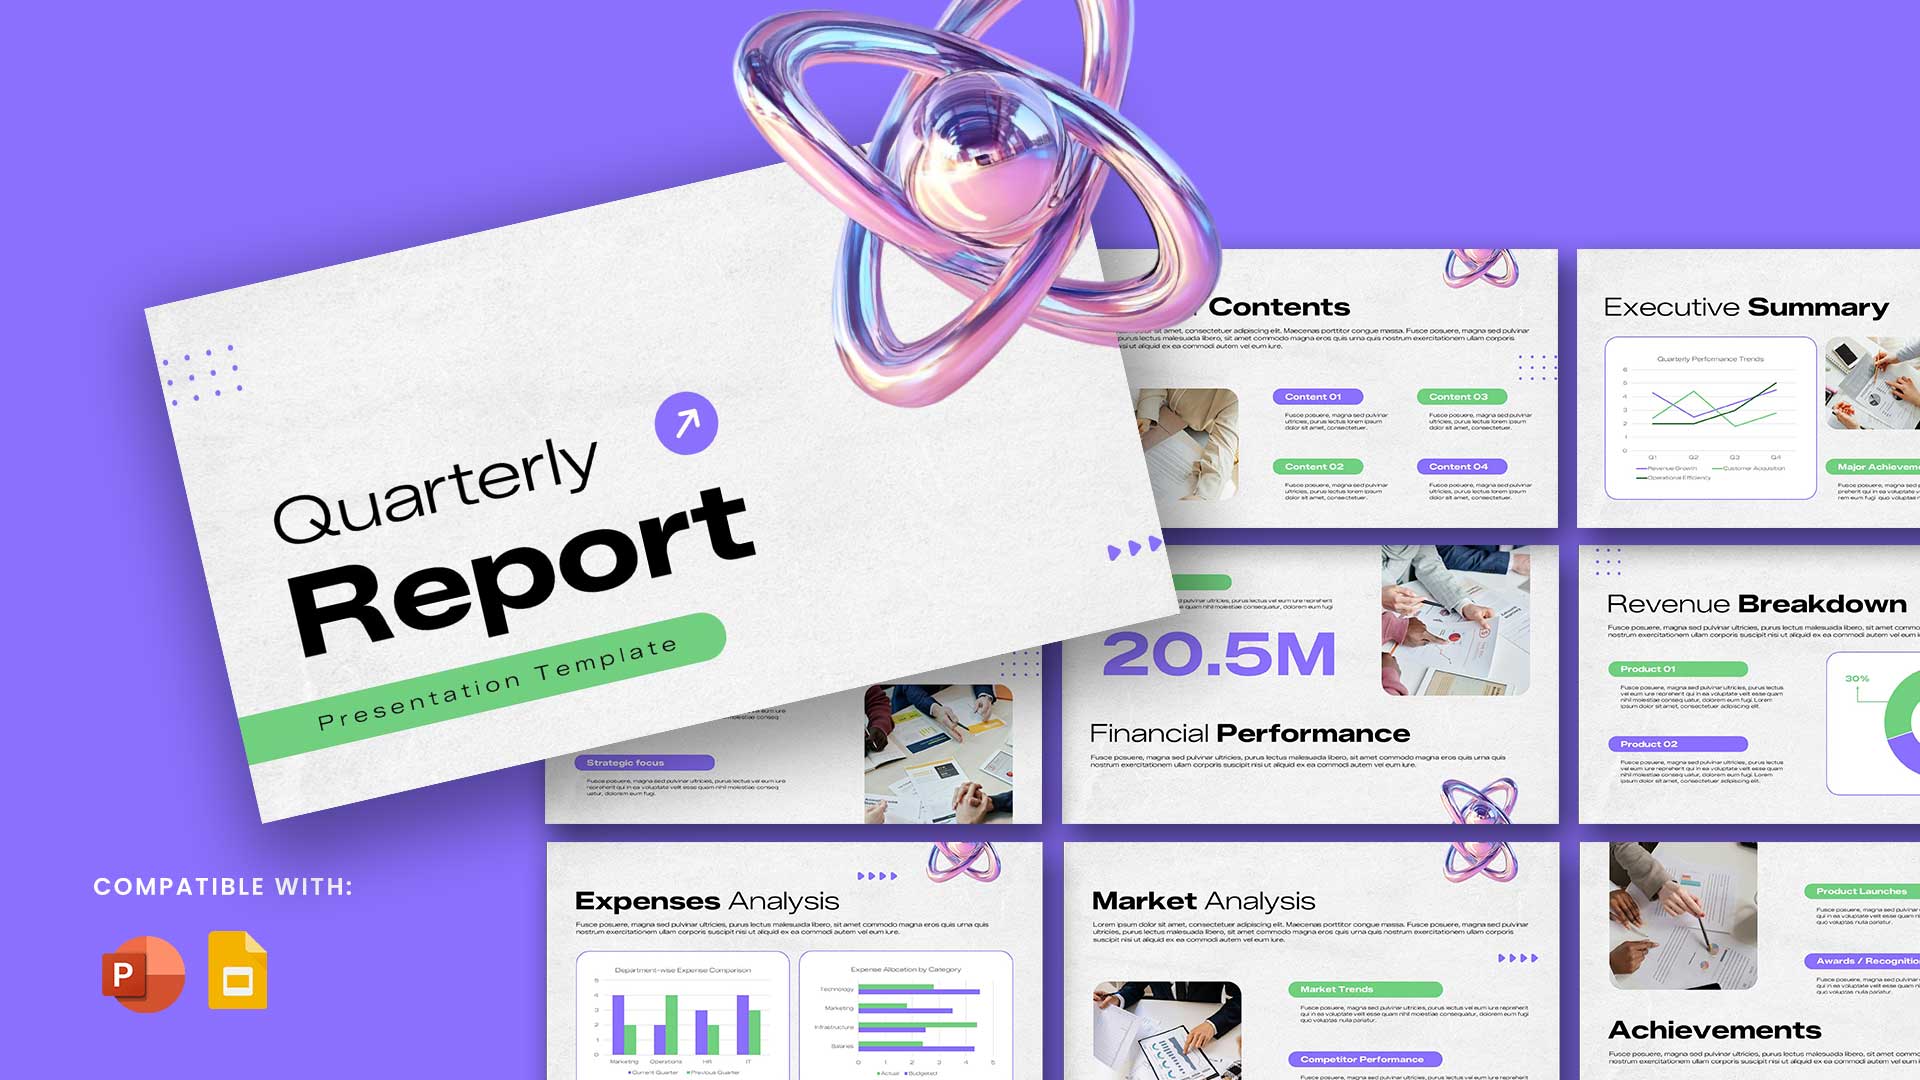
Quarterly Report Template for PowerPoint and Google Slides
-
Editable Financial Report Template for Business Presentations
-
SEO Report Template for PowerPoint and Google Slides


Are you looking for Custom Presentation Template Designs?
It is a long established fact that a reader will be distracted by the readable content of a page when or randomised words which don’t look even slightly believable