
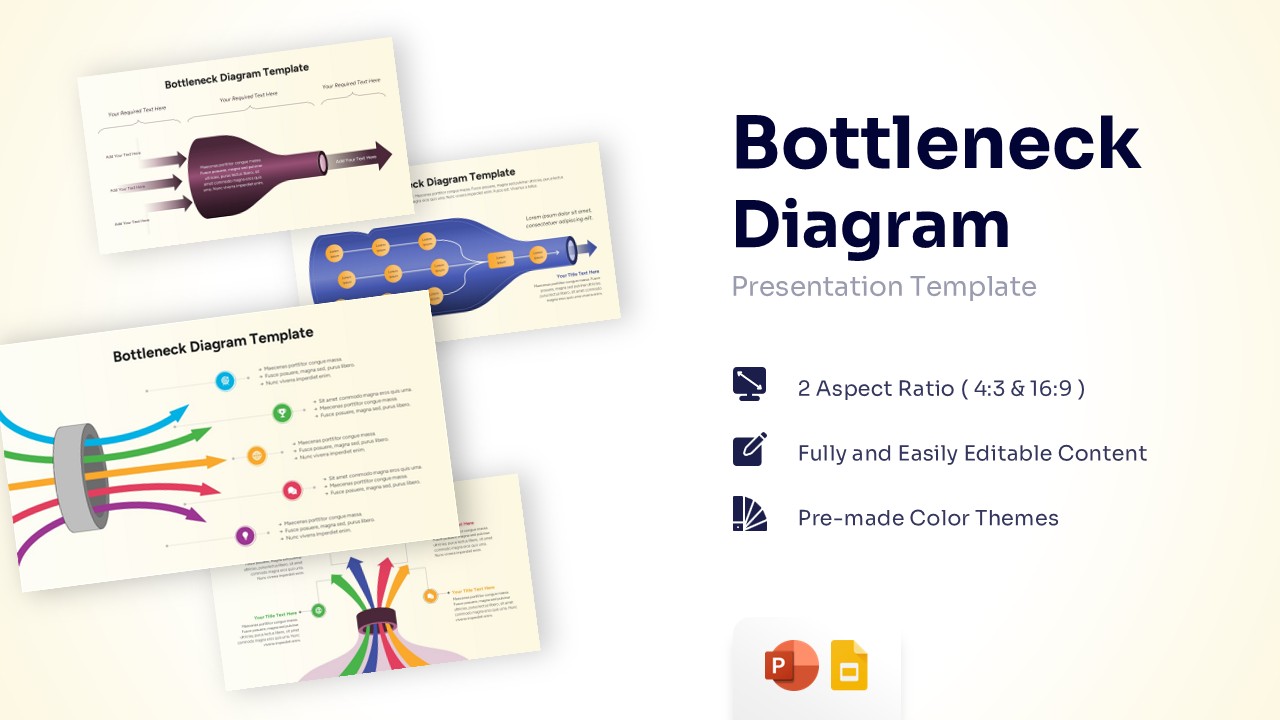
Bottleneck Diagrams PowerPoint Template
0
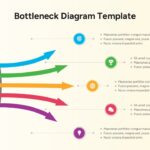
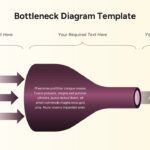
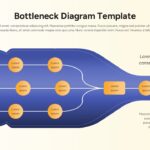
About the Template
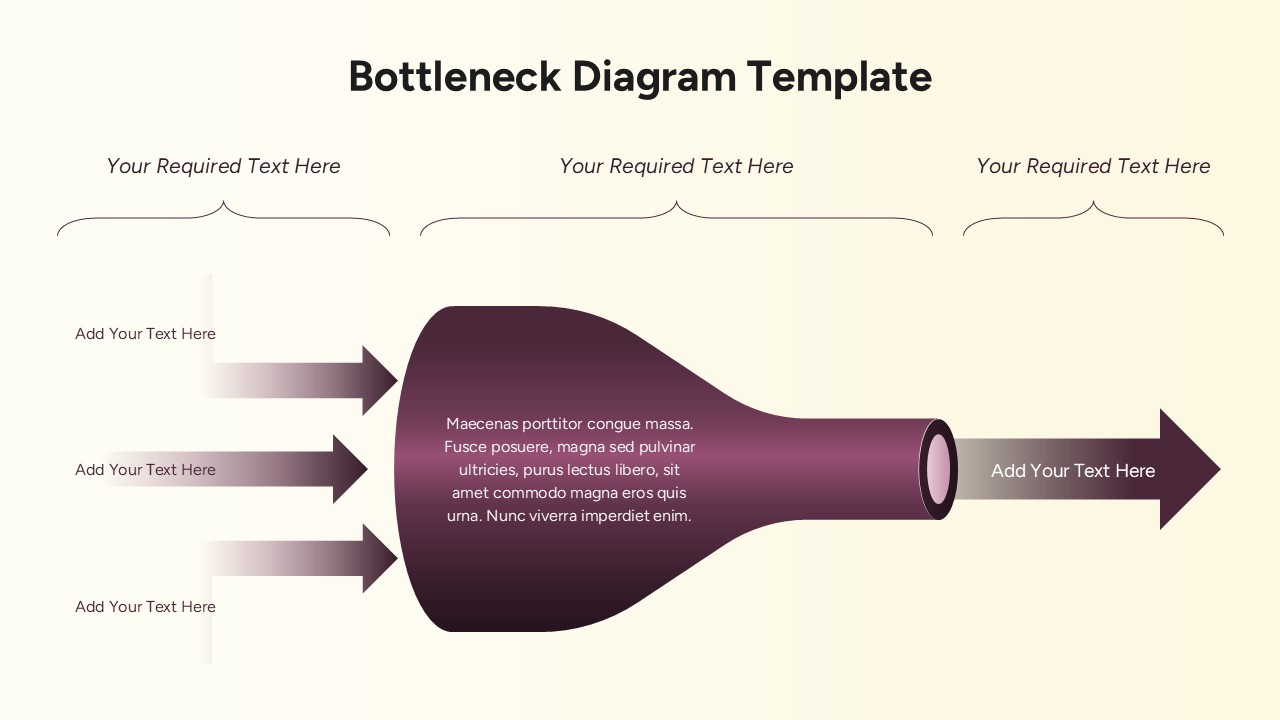
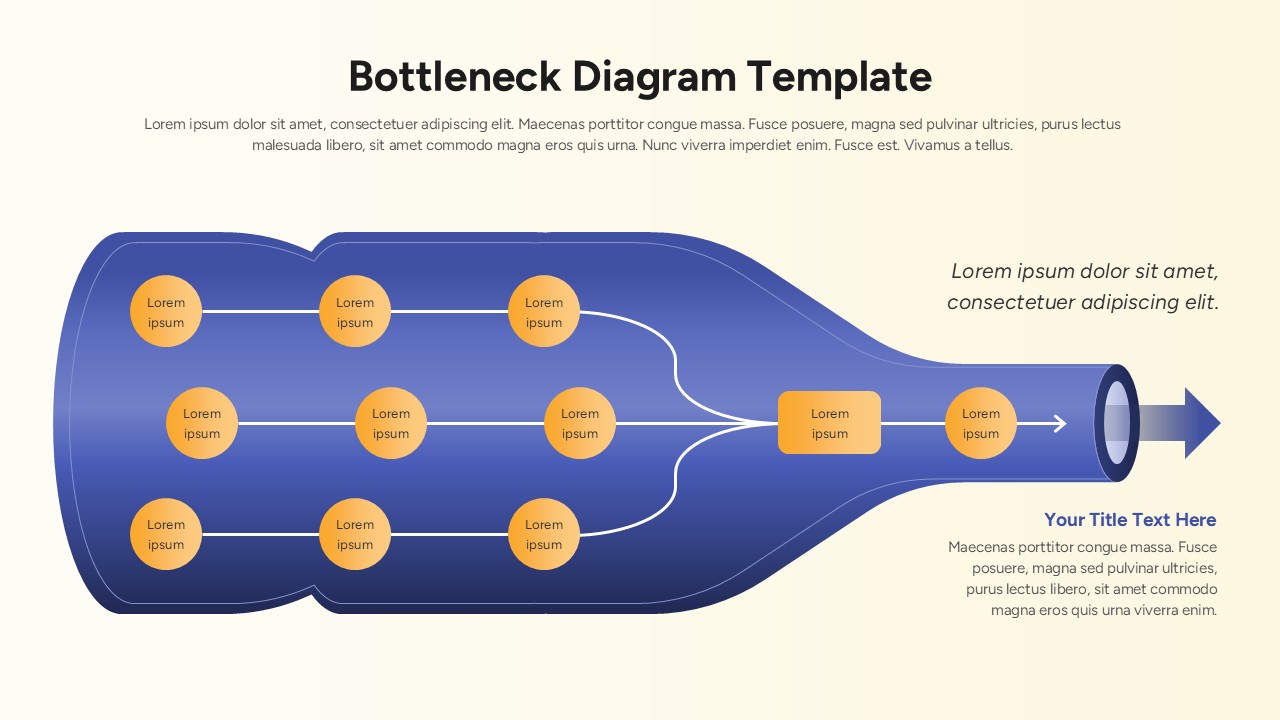
Every business, manufacturing plant, and operational workflow has a breaking point—a single restricted phase where productivity slows down, expenses mount, and revenue stalls. Pinpointing that hidden constraint is the difference between stagnation and hyper-growth. Download the Bottleneck Diagrams PowerPoint Template on SlideChef to visualize, analyze, and resolve operational blockages with surgical precision. Featuring professional vector bottle illustrations, process flow arrows, clean typographic hierarchy, and fully editable multi-color themes, this presentation toolkit translates complex process analytics into clear, actionable strategy slides.
Decoding Process Constraints: What Is a Bottleneck Diagram?
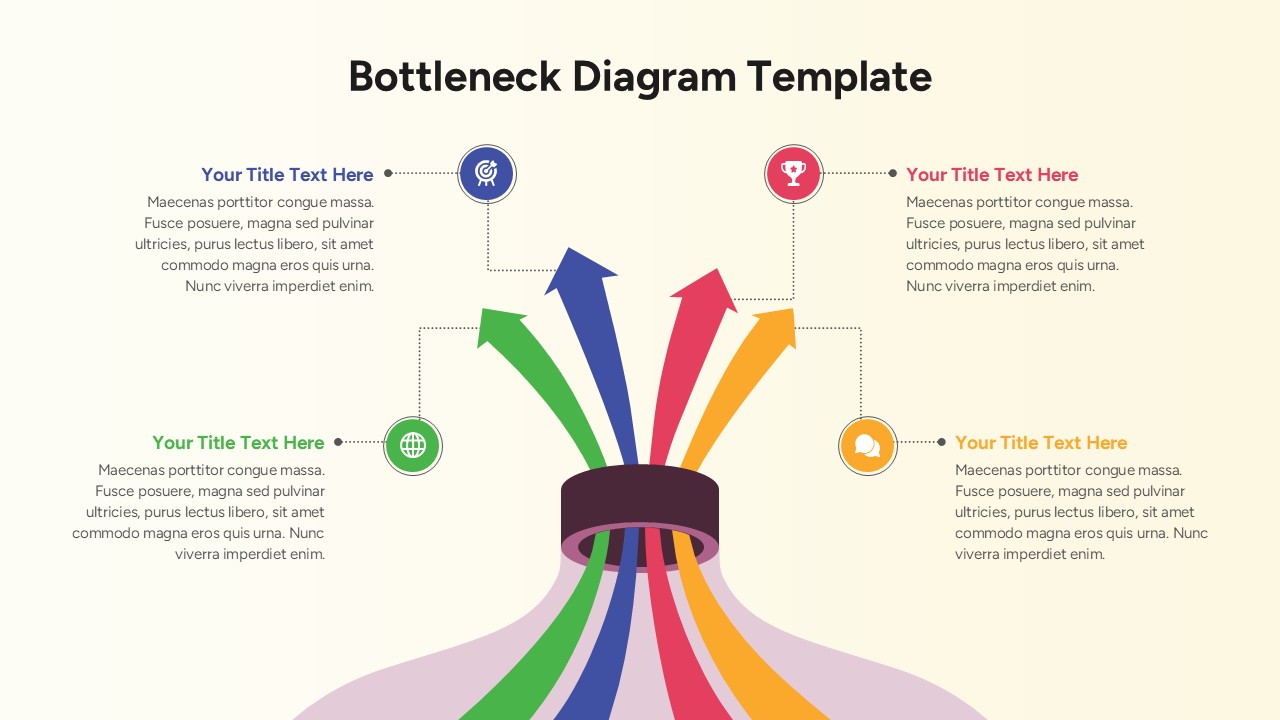
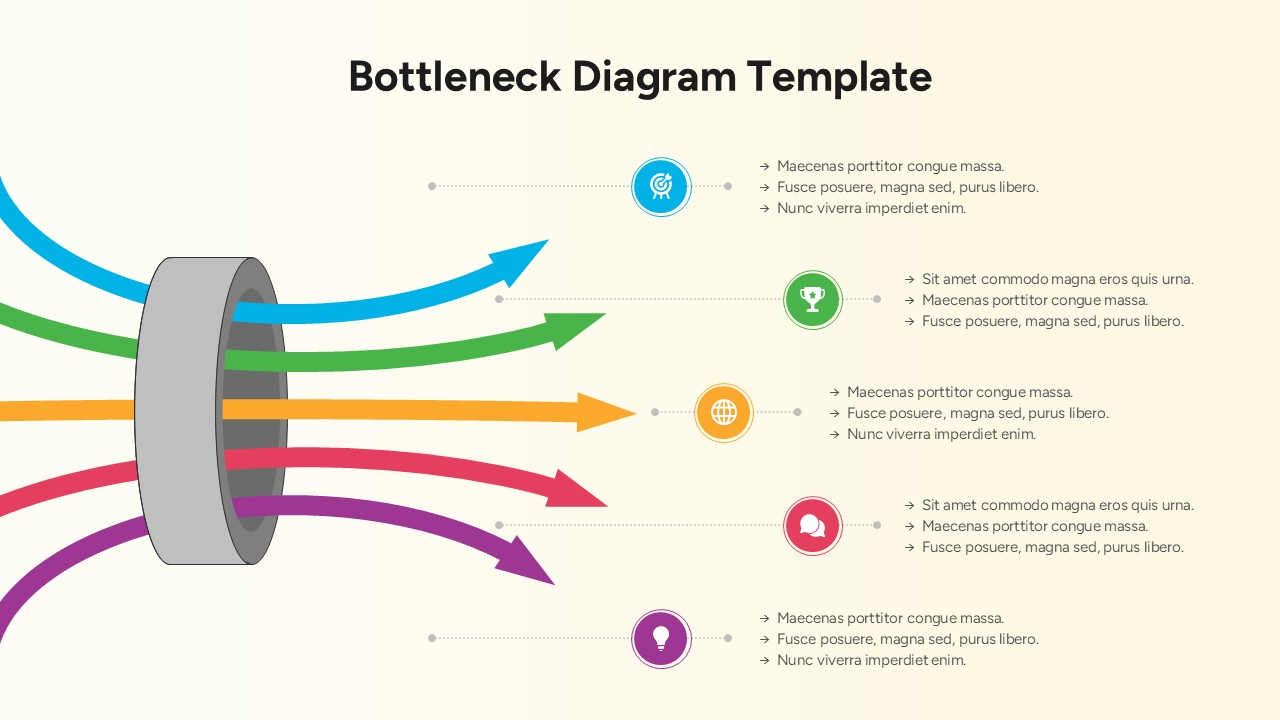
A bottleneck diagram is a visual process-mapping tool designed to identify the exact stage in a production line, software pipeline, or business workflow where capacity is constrained. Much like the neck of a glass bottle restricting fluid flow, operational bottlenecks limit total output regardless of how fast preceding steps operate. By visually mapping inputs, throughput capacity, and restrictive choke points, teams can allocate resources precisely where they are needed most to optimize efficiency.
Stop guessing where your processes break down and start presenting data-driven solutions that command executive buy-in. Download the Bottleneck Diagrams for PowerPoint and Google Slides and, streamline your workflows, and maximize operational throughput!


Related
-

Manufacturing Industry PowerPoint Template
-
Free PowerPoint Tree Diagram Template
-
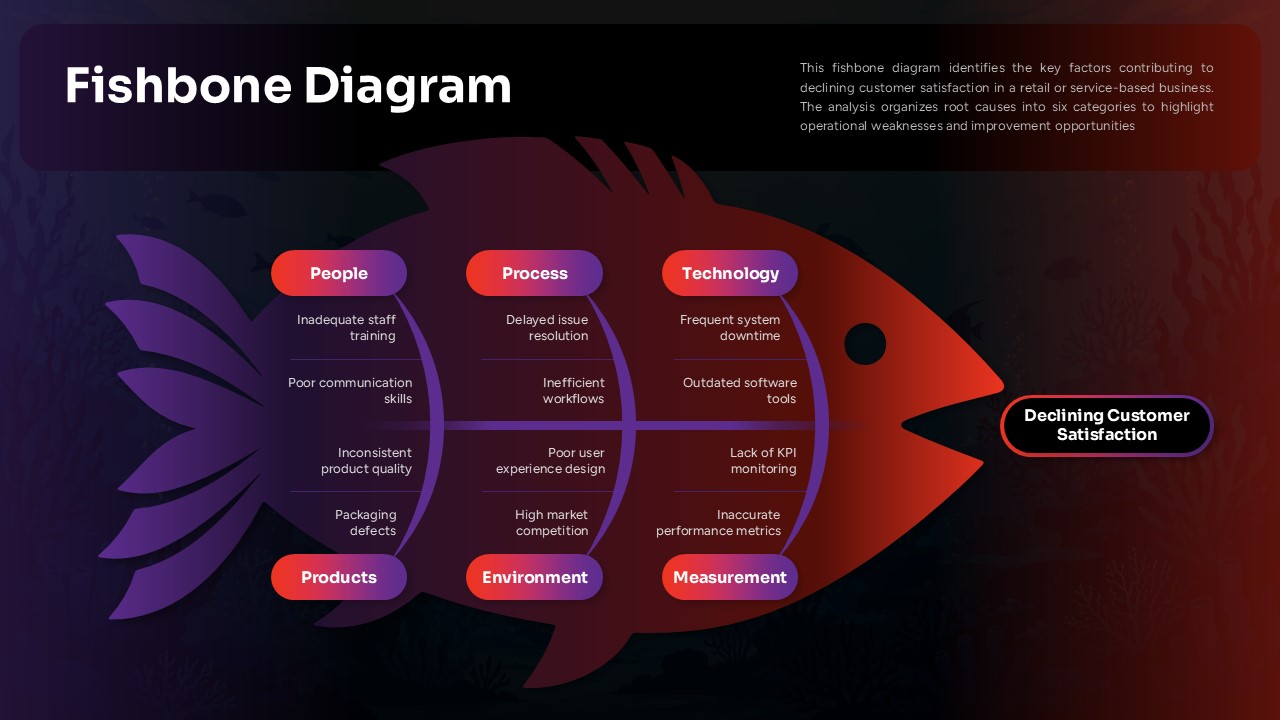
Fishbone Diagram Template for PowerPoint and Google Slides
-
Free Google Slides Business Process Diagram PowerPoint Template
-
Medical Report Template for PowerPoint and Google Slides
-
Swimlane Diagram PowerPoint and Google Slides

Are you looking for Custom Presentation Template Designs?
It is a long established fact that a reader will be distracted by the readable content of a page when or randomised words which don’t look even slightly believable