Data Analysis Presentation Template

0


About the Template
Data Analysis Report PowerPoint Template and Google Slides
Command the boardroom and transform raw numbers into actionable intelligence with the Data Analysis Presentation Template. Specifically engineered for corporate executives, business analysts, and strategic consultants, this data presentation deck is a masterclass in minimalist, high-contrast design. In an era where data-driven decision-making is the ultimate competitive advantage, this template provides the sophisticated visual framework necessary to bridge the gap between technical metrics and executive-level storytelling. Featuring a modern “Swiss-style” aesthetic—pairing professional monochrome architectural imagery with precise sky-blue accents—this toolkit ensures your quarterly reviews, revenue projections, and market share insights are delivered with absolute clarity and executive authority.
A Precision-Engineered Toolkit for Business Intelligence
This Data Analysis Report template moves away from cluttered, over-designed slides, offering a suite of clean, data-forward layouts that prioritize scannability and strategic impact:
-
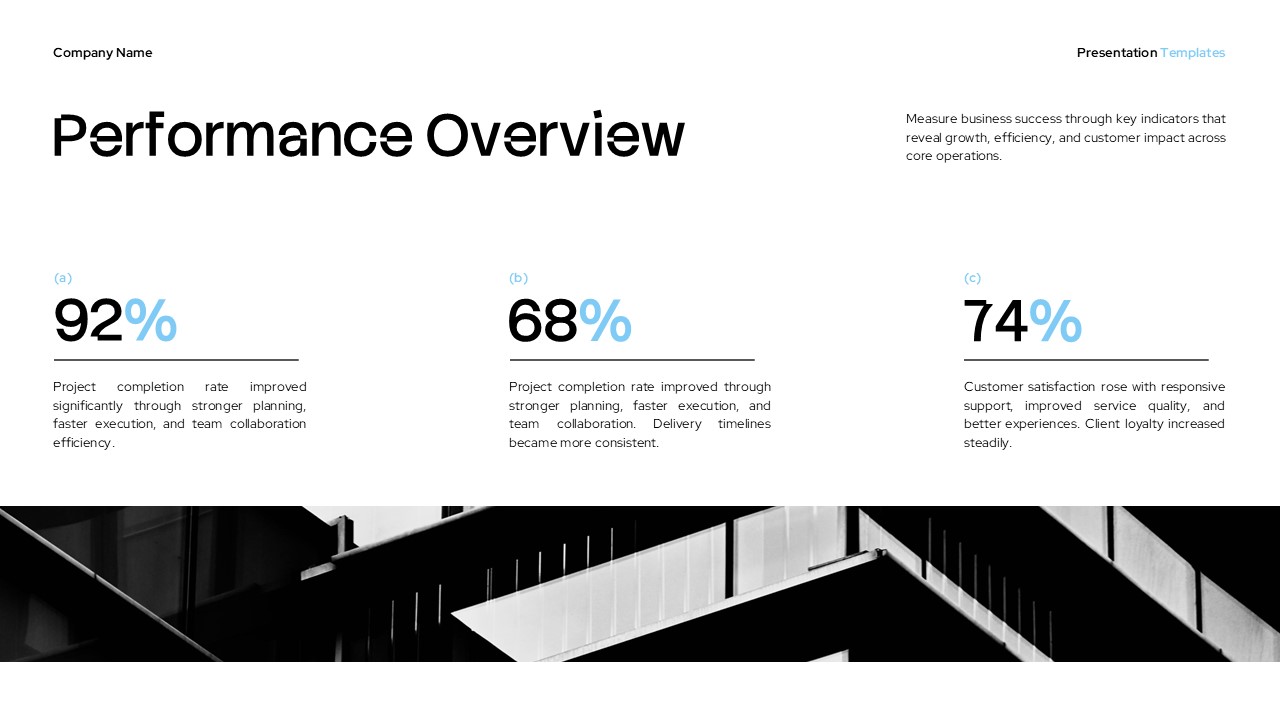
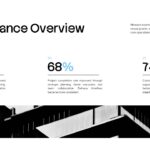
Executive Performance Dashboards: Instantly communicate project health and operational success using specialized layouts for high-impact percentage callouts, such as 92% project completion rates and 74% customer satisfaction scores.
-
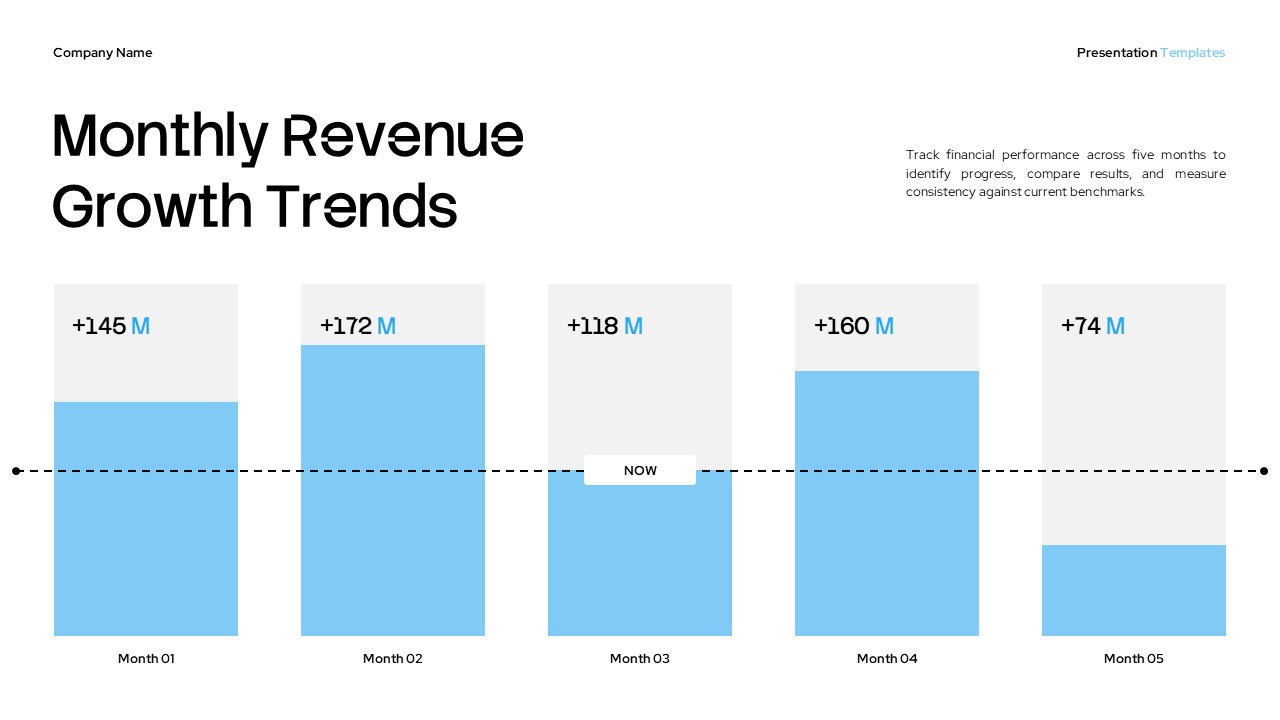
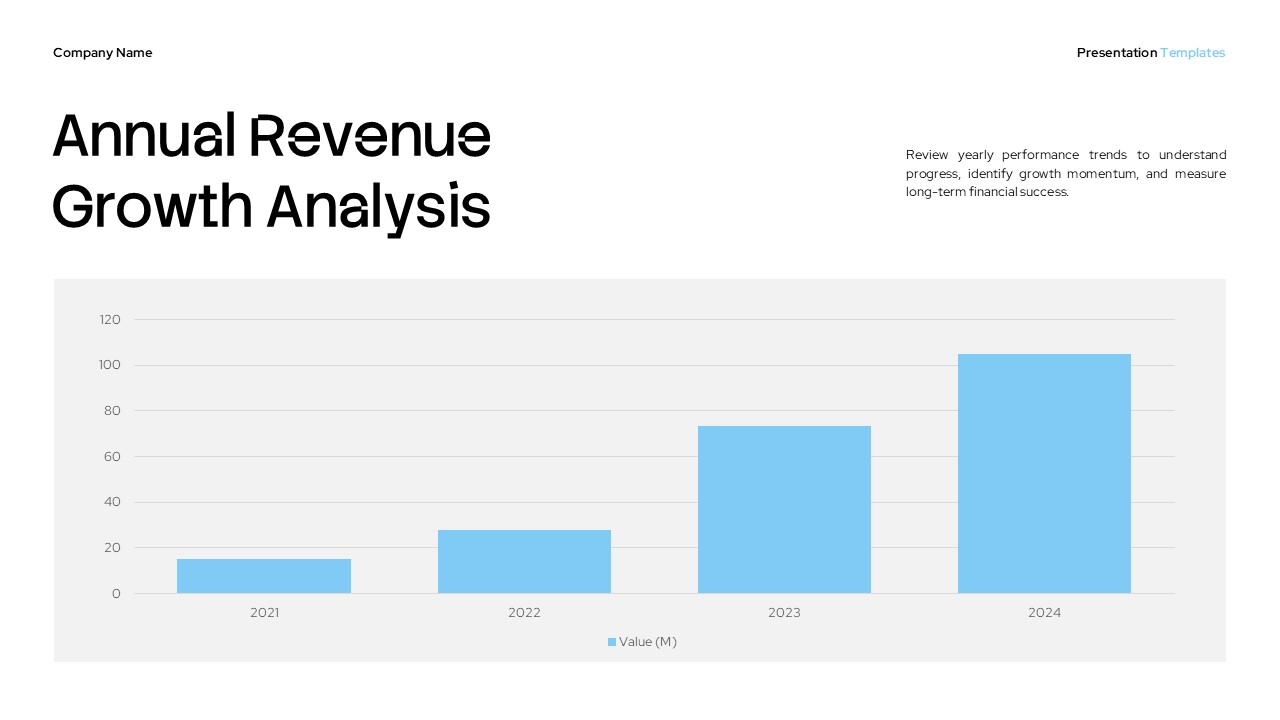
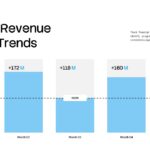
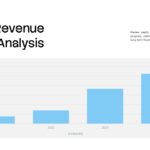
Dynamic Revenue & Trend Analysis: Showcase financial trajectories with professional bar charts designed for both Annual Revenue Growth (2021–2024) and Monthly Growth Trends, allowing you to pinpoint momentum with precision.
-
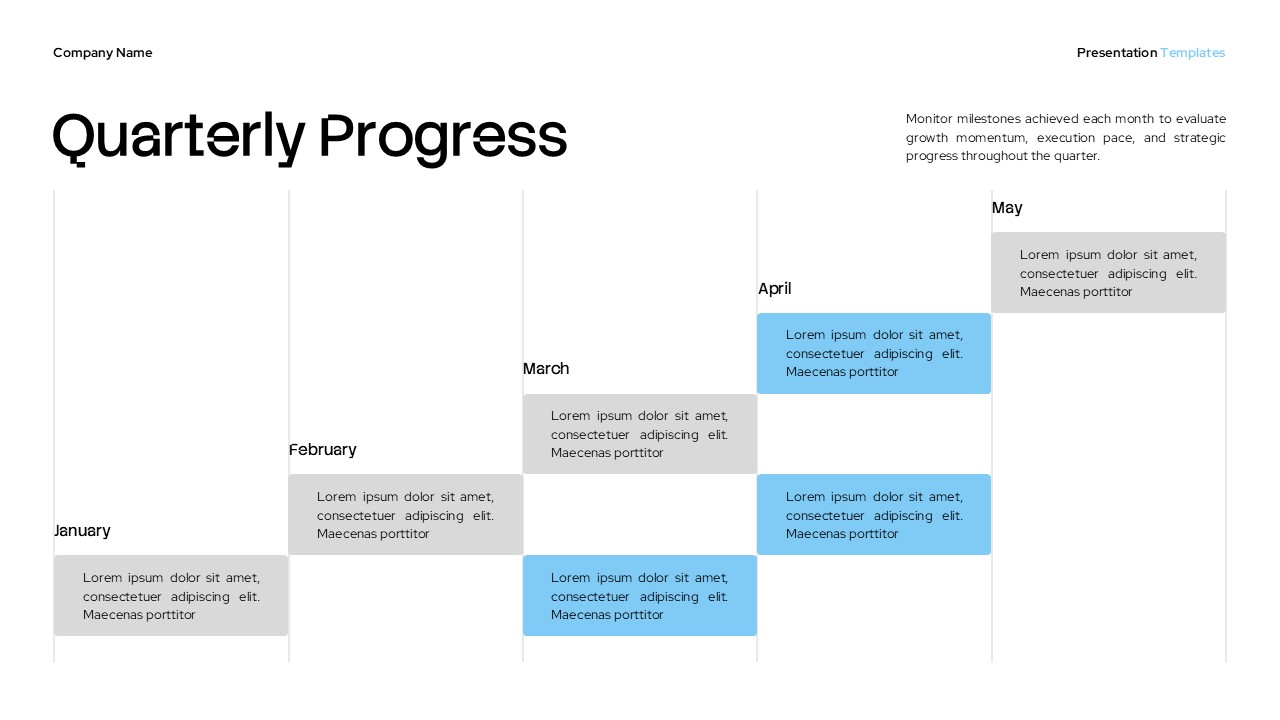
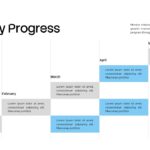
Strategic Progress Mapping: Track organizational milestones across the fiscal year with a unique Quarterly Progress matrix that visualizes execution pace and project density from January through May.
-
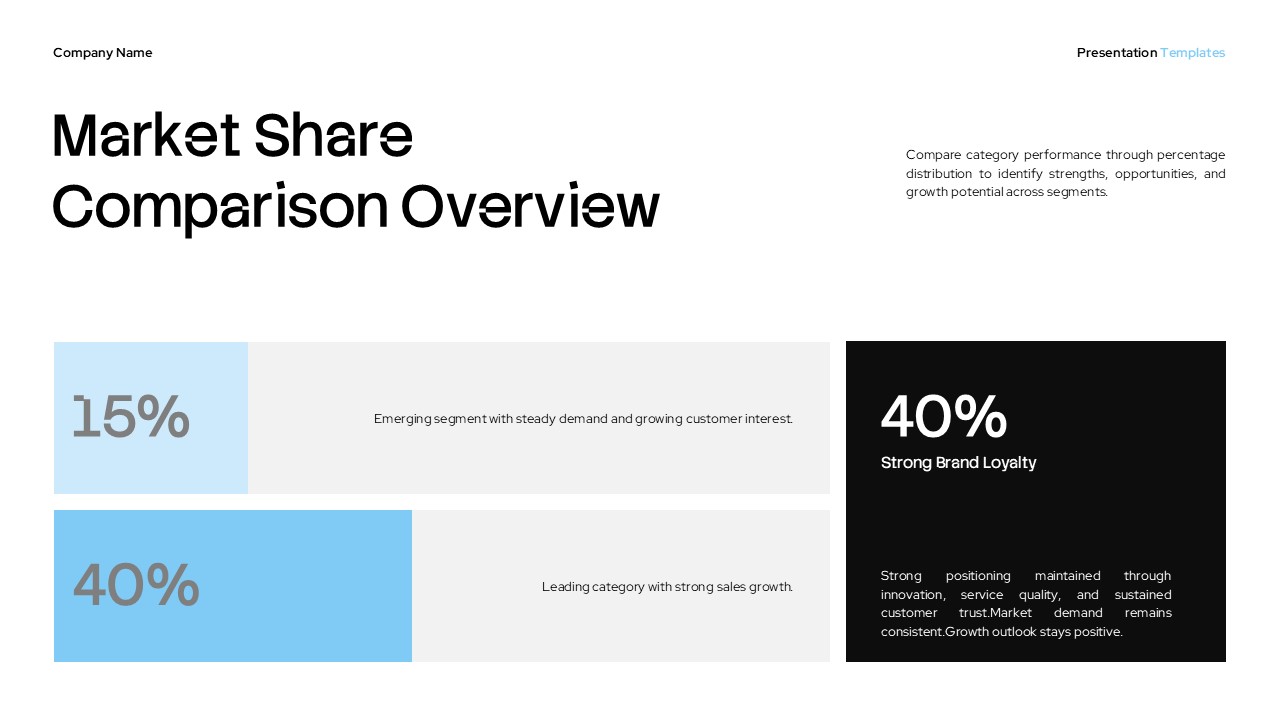
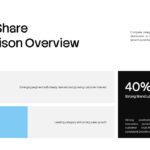
Competitive Market Overviews: Break down industry positioning using clean, tiled comparison blocks that contrast market share percentages against qualitative insights like brand loyalty and emerging segment growth.
-
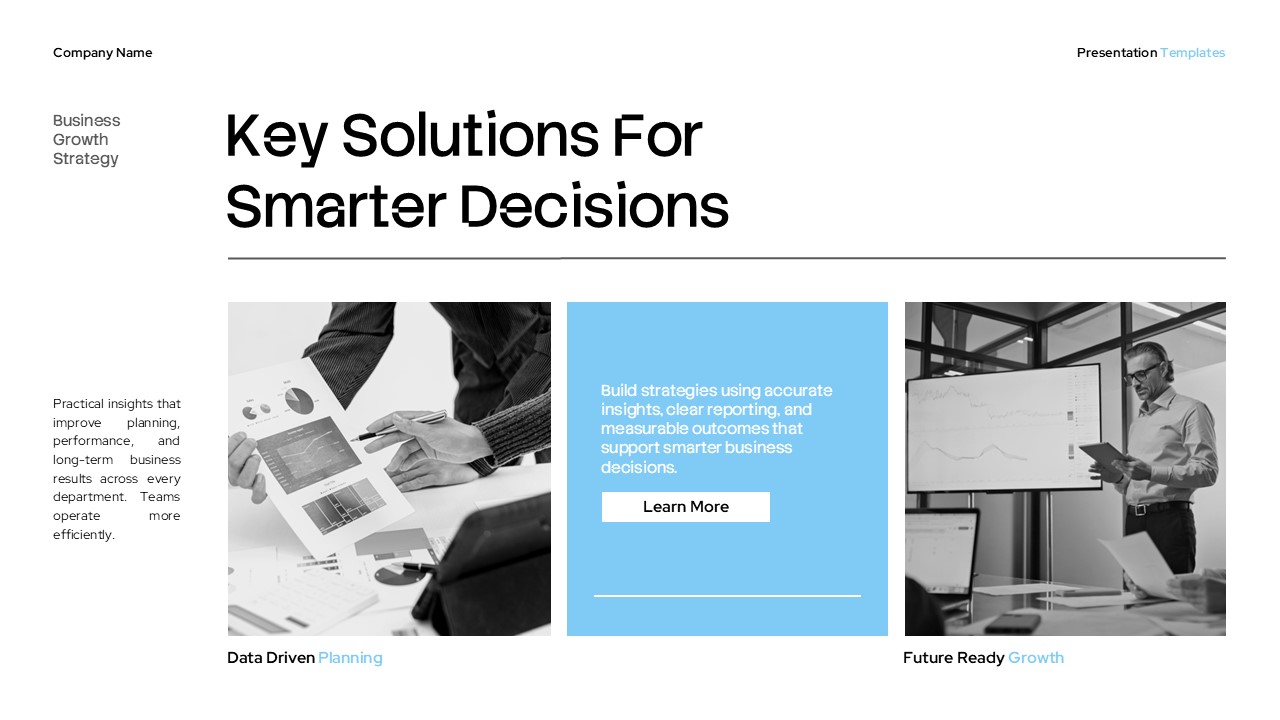
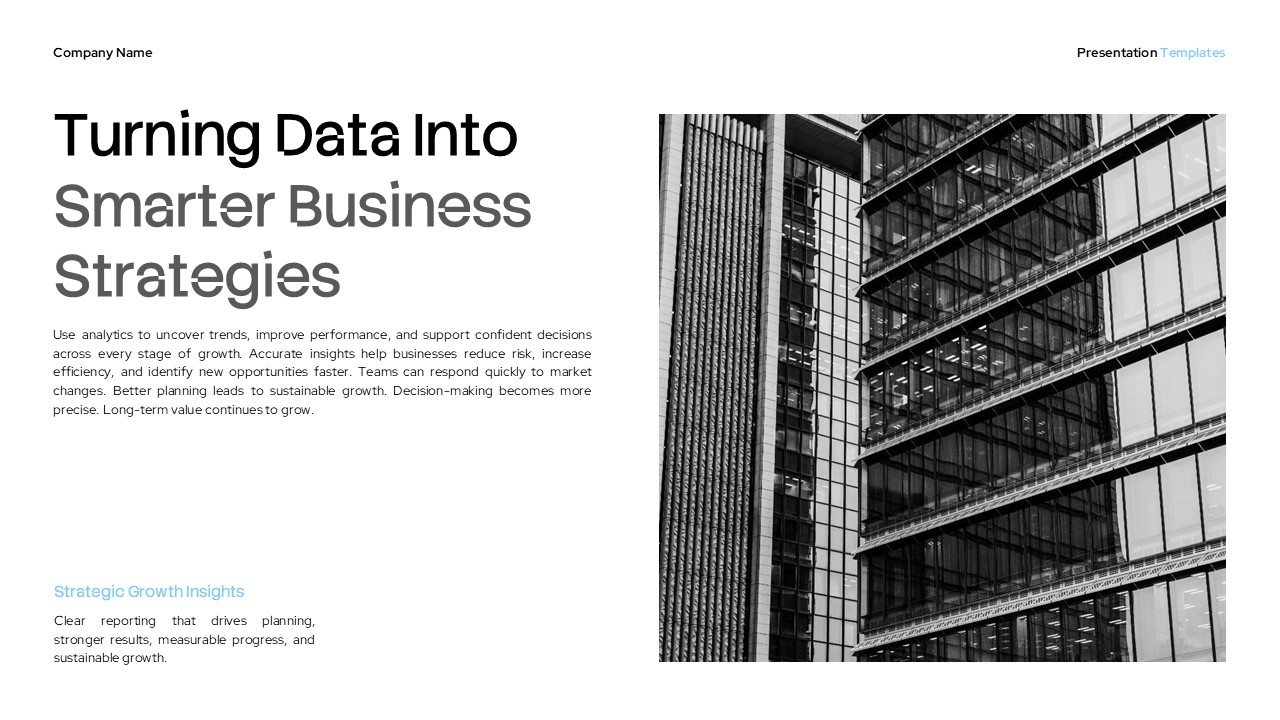
Actionable Strategy Frameworks: Transition from “what happened” to “what’s next” with dedicated slides for Key Solutions and Turning Data into Smarter Business Strategies, encouraging your audience to move toward data-driven planning and future-ready growth.
This Data Analysis Presentation Template is Designed For
-
Corporate Executives & C-Suite Leaders: Ideal for quarterly business reviews (QBRs) and high-level board presentations where data needs to be synthesized into clear, executive-ready insights.
-
Business Analysts & Data Strategists: A perfect toolkit to translate complex, messy datasets and sprawling spreadsheets into clean, visually structured business intelligence models.
-
Management Consultants & Strategy Directors: Deliver high-stakes advisory reports and strategic recommendations with a polished, minimalist aesthetic that signals authoritative professionalism.
-
Operations & Project Managers: Effectively track, analyze, and present multi-month project lifecycles, operational efficiency metrics, and departmental performance KPIs.
-
Financial Controllers & Growth Marketers: A seamless visual framework to present annual revenue trends, market penetration growth data, and budget allocations to investors and stakeholders.
-
Corporate Trainers & HR Managers: Seamlessly design internal onboarding slides or alignment decks focused on teaching teams how to use data-driven decision-making to scale business workflows.
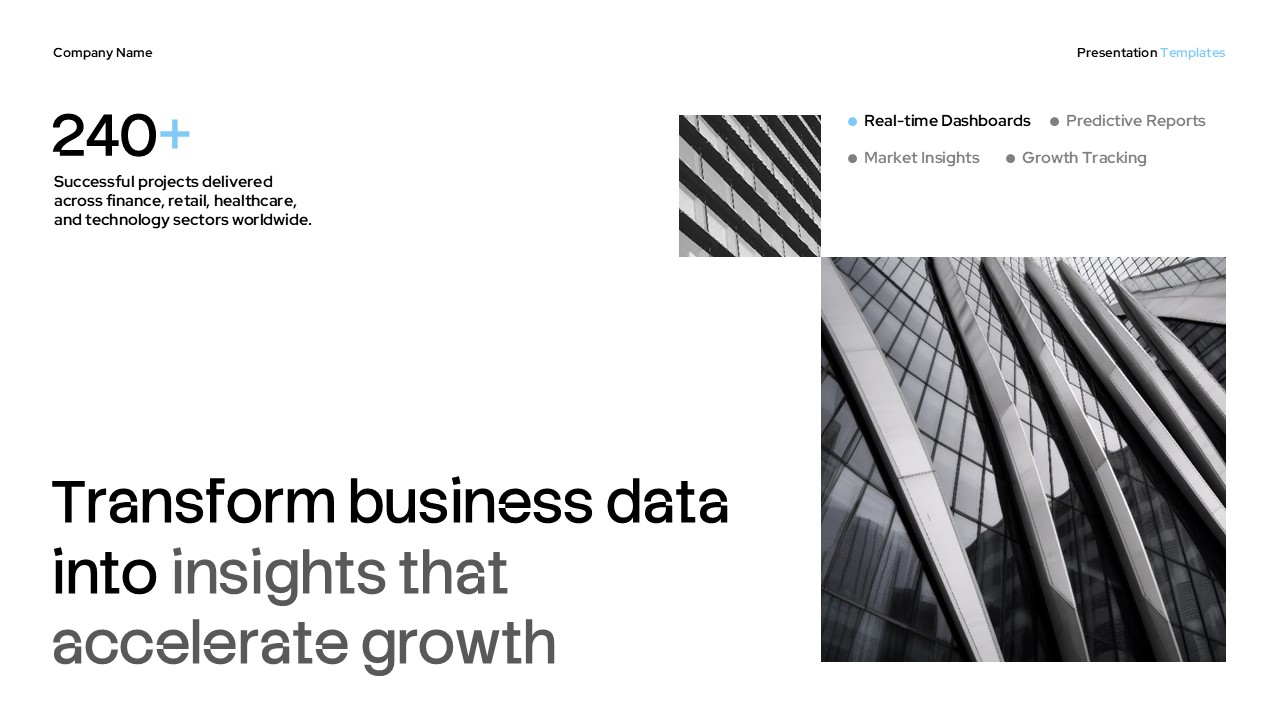
Give your data the professional platform it needs to inspire confidence and drive smarter, faster decisions. Download the Data Analysis Presentation Template today and turn your organization’s business data into the insights that accelerate growth!
Related
-

Competitive Industry Report PowerPoint Template & Google Slides
-
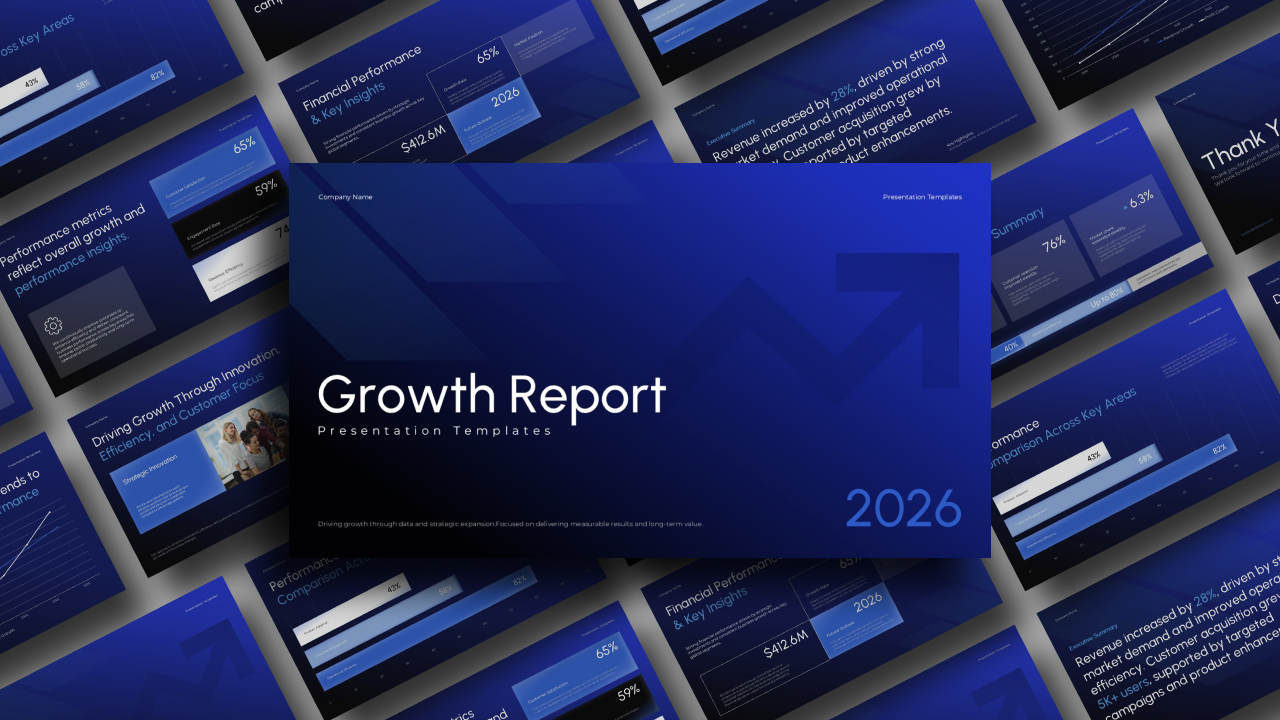
Growth Report Template for PowerPoint and Google Slides
-
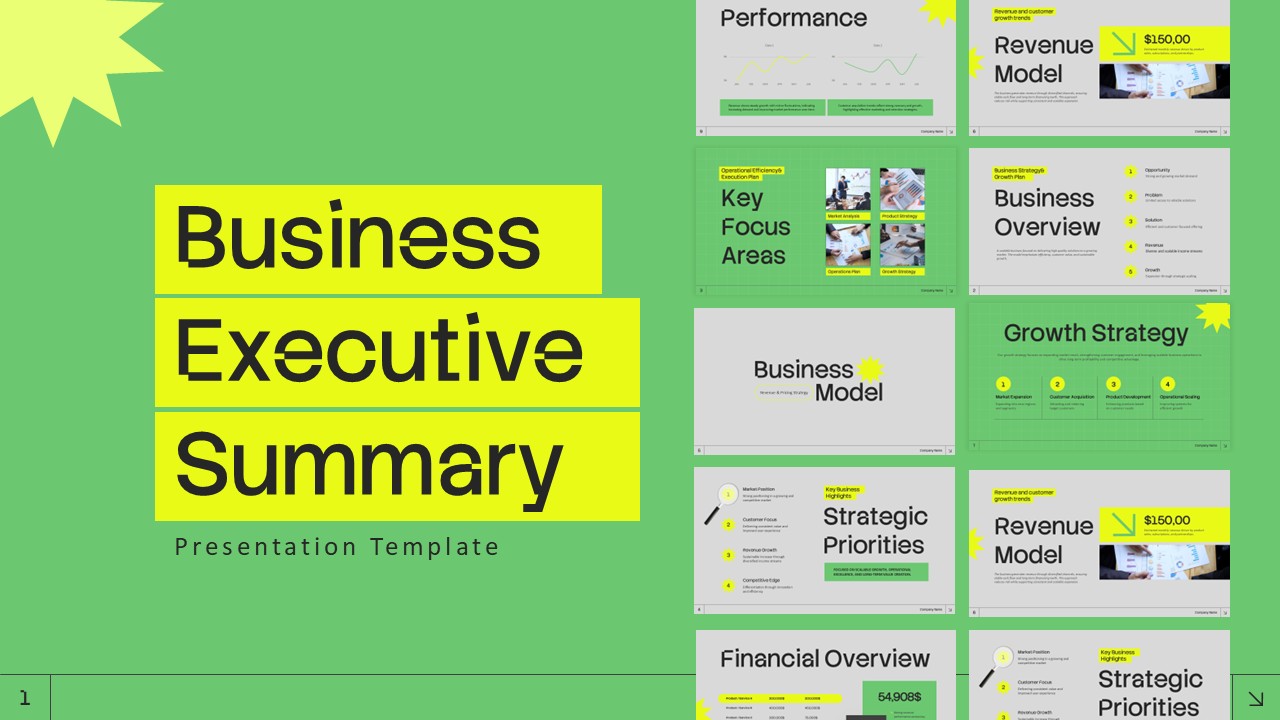
Business Executive Summary Template for PowerPoint & Google Slides
-
Market Research Template for PowerPoint and Google Slides
-
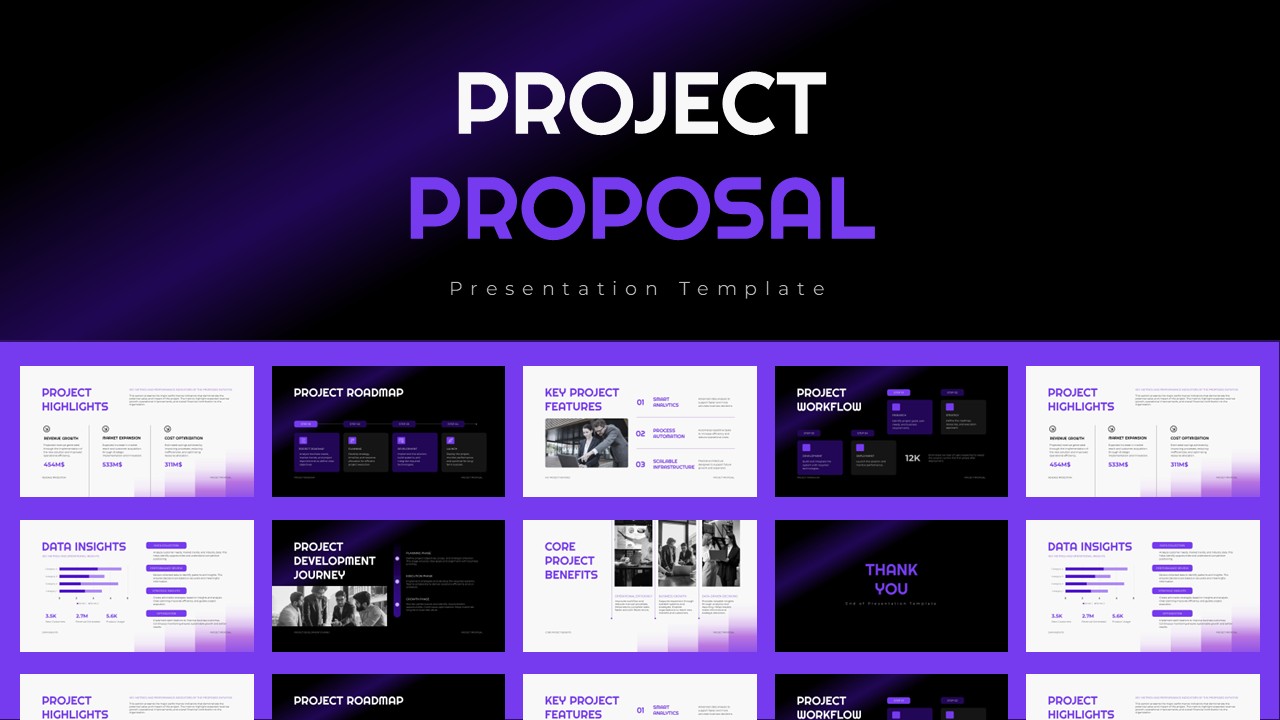
Project Proposal Template for PowerPoint and Google Slides
-

Corporate Strategy Template for PowerPoint & Google Slides


Are you looking for Custom Presentation Template Designs?
It is a long established fact that a reader will be distracted by the readable content of a page when or randomised words which don’t look even slightly believable